Fig. 5
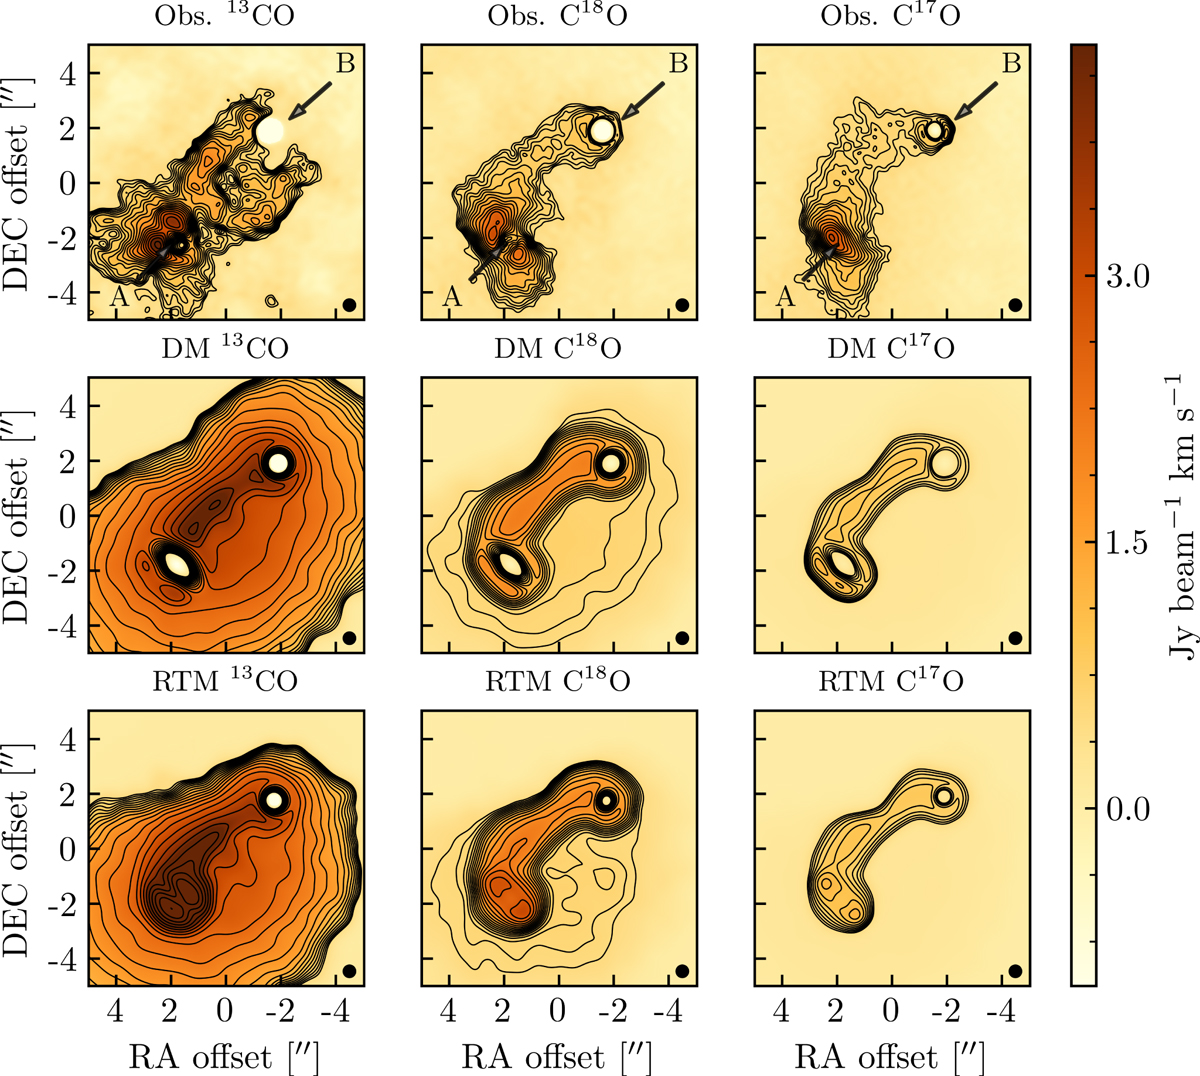
Zeroth moment maps of the observed and synthetic CO isotopologue gas line emission. Contour levels are divided logarithmically from 0.5 to 7.3 Jy beam−1 km s−1. The RA and Dec offsets are relative to the phase center of the observations. See Table 4 for abundances. DM denotes the PP-disk model and RTM denotes the rotating toroid model.
Current usage metrics show cumulative count of Article Views (full-text article views including HTML views, PDF and ePub downloads, according to the available data) and Abstracts Views on Vision4Press platform.
Data correspond to usage on the plateform after 2015. The current usage metrics is available 48-96 hours after online publication and is updated daily on week days.
Initial download of the metrics may take a while.