Fig. F.4
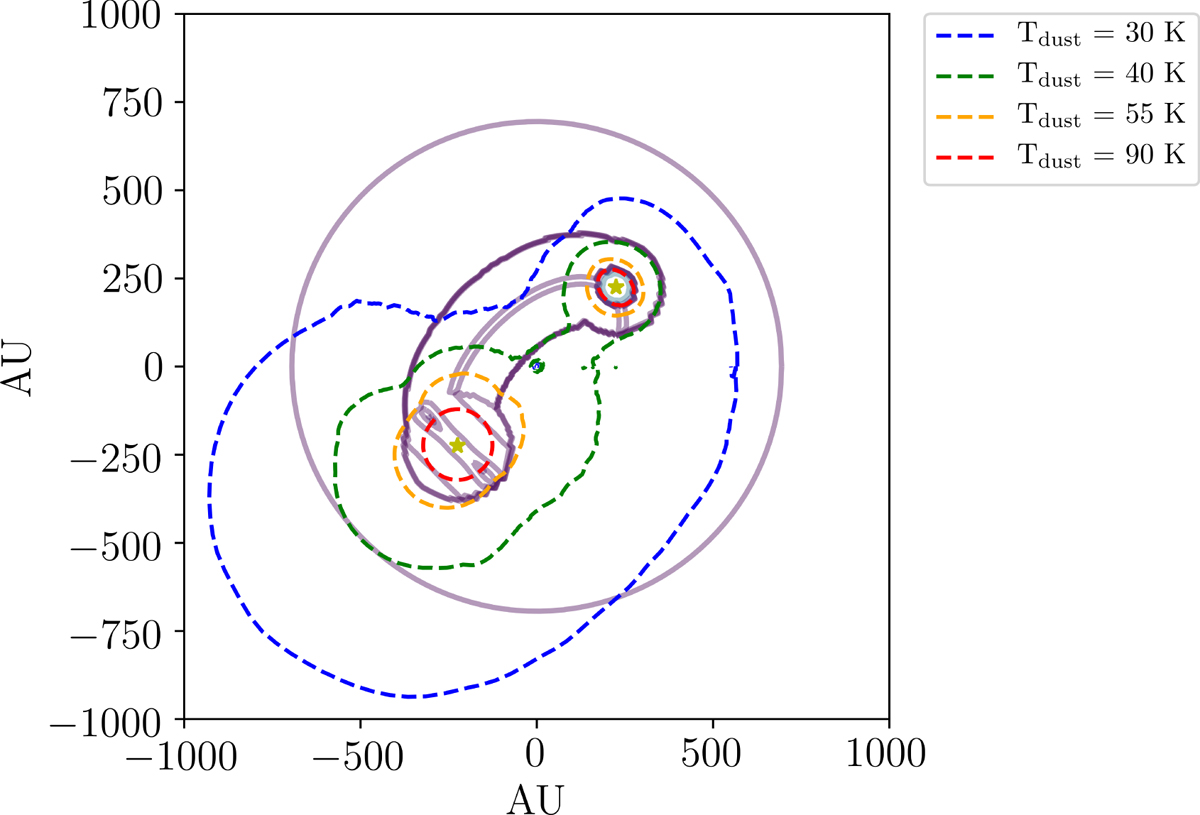
Temperature contours for a rotating toroid around each source and a dust filament between the sources in a slice through the model at z (height) = 0. Dust density contours are shown in a gray to green colormap. The radial power-law density distribution is visible along with the dust filament and rotating toroids. Here LA = 18 L⊙ and LB = 3 L⊙. The source A rotating toroid is edge-on while the source B rotating toroid is face-on. The 90 K contour around source B coincides with the transition from disk to dust filament. Due to the high number of grid cells, some temperature noise is visible in the plot center (due to very small cells with bad photon statistics in RADMC-3D). Interpolation has been performed along the temperature contours to make them appear more smooth for visual purposes, as the contours were otherwise slightly noisy in certain regions.
Current usage metrics show cumulative count of Article Views (full-text article views including HTML views, PDF and ePub downloads, according to the available data) and Abstracts Views on Vision4Press platform.
Data correspond to usage on the plateform after 2015. The current usage metrics is available 48-96 hours after online publication and is updated daily on week days.
Initial download of the metrics may take a while.