Fig. 8
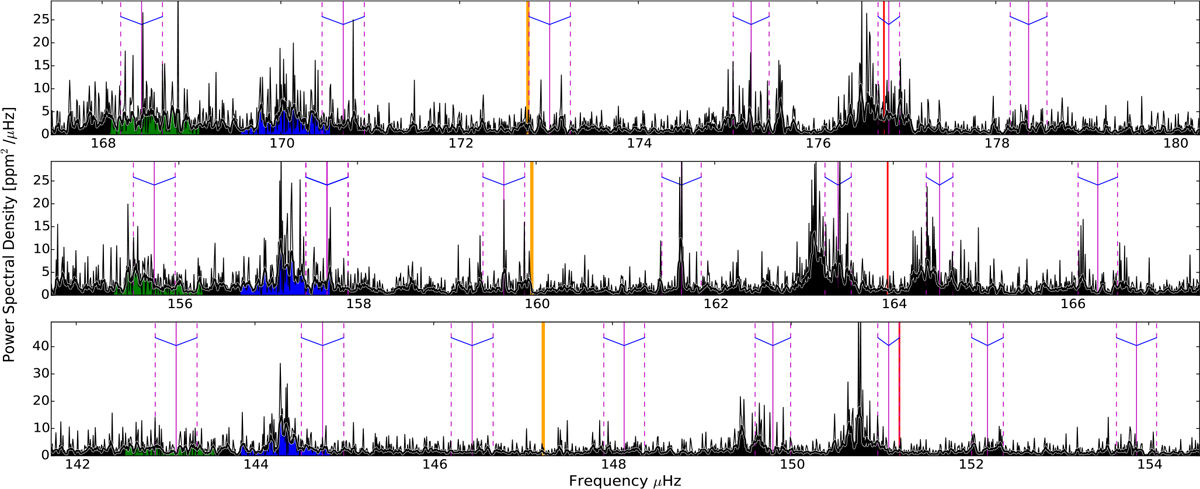
Power-density spectrum of KIC 9163796. Each panel contains one radial order, depicting the original power spectrum as well as the spectrum smoothed through theMode identifications of the pure (theoretical) p modes for ℓ = 0, 1, 2 and 3 which are indicated with blue, red, green and yellow vertical bars, respectively. The effects of rotation are visible as the splitting of dipole modes (assumed δf = 290 nHz), located in the centre of each panel. The observed PSD is overlaid with the theoretical frequencies of mixed-dipole modes (m = 0, solid thin lines) and the theoretical frequencies of the rotationally split components (m = ±1, dashed thin lines). The components belonging to one rotationally split multiplet are indicated through V -markers at the top of each panel.
Current usage metrics show cumulative count of Article Views (full-text article views including HTML views, PDF and ePub downloads, according to the available data) and Abstracts Views on Vision4Press platform.
Data correspond to usage on the plateform after 2015. The current usage metrics is available 48-96 hours after online publication and is updated daily on week days.
Initial download of the metrics may take a while.