Fig. 6
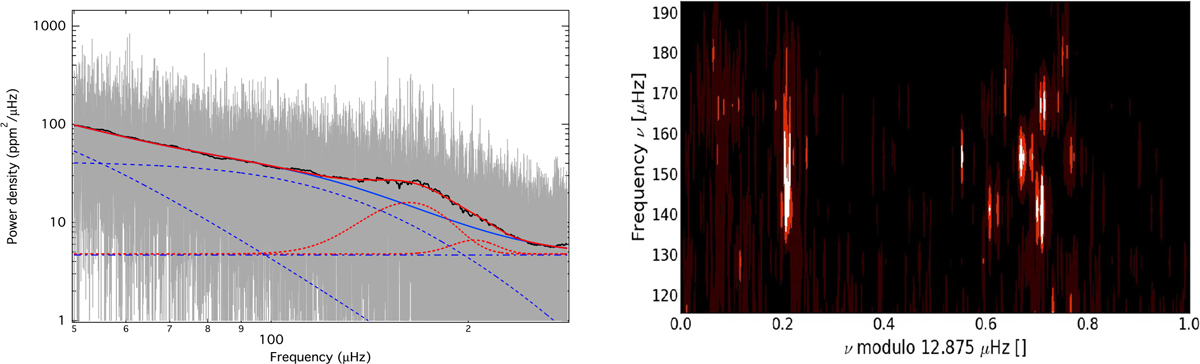
Power spectral density (left) and échelle diagram (right) of KIC 9163796. In the left panel, the original and smoothed spectrum are shown as grey and black solid lines, respectively. The different components that describe the granulation background are shown as blue dashed, while the white noise component as blue dash-dotted line. The two Gaussian envelopes to describe the power excess of the primary and reflection of the super-Nyquist power excess into the sub-Nyquist regime of the secondary are represented as red dotted lines. The combined fits with and without the oscillation components are depicted as red and blue solid lines.
Current usage metrics show cumulative count of Article Views (full-text article views including HTML views, PDF and ePub downloads, according to the available data) and Abstracts Views on Vision4Press platform.
Data correspond to usage on the plateform after 2015. The current usage metrics is available 48-96 hours after online publication and is updated daily on week days.
Initial download of the metrics may take a while.