Fig. 1
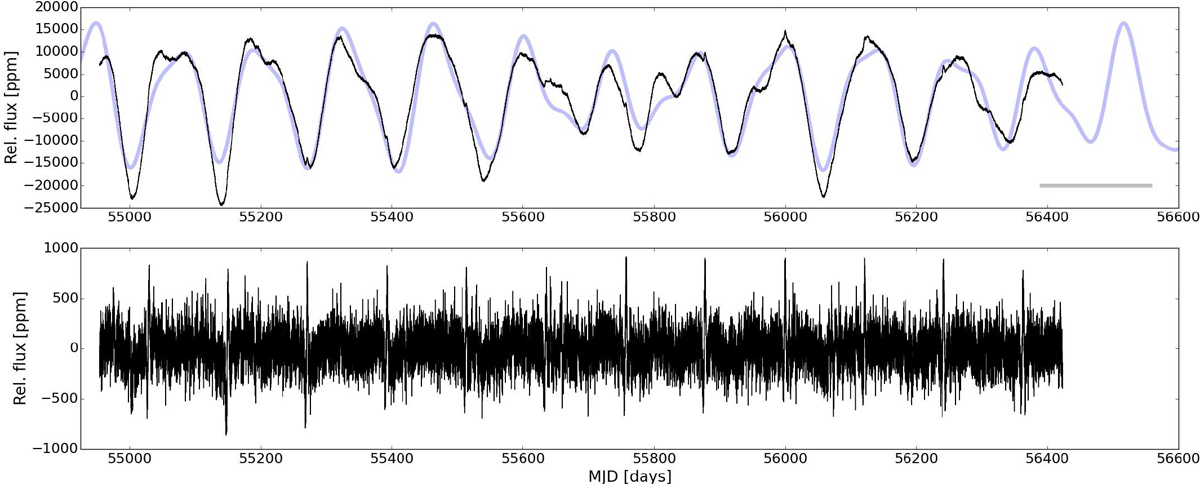
Light curve of KIC 9163796. The top and lower panels show the full light curve (Q0–Q17), smoothed with a filter of 150 and 4 days, respectively. The synthetic light curve, depicted as solid light grey line is calculated from the four significant frequencies from Table 2. The time base of the spectroscopic monitoring is indicated through the horizontal grey bar.
Current usage metrics show cumulative count of Article Views (full-text article views including HTML views, PDF and ePub downloads, according to the available data) and Abstracts Views on Vision4Press platform.
Data correspond to usage on the plateform after 2015. The current usage metrics is available 48-96 hours after online publication and is updated daily on week days.
Initial download of the metrics may take a while.