Fig. 7
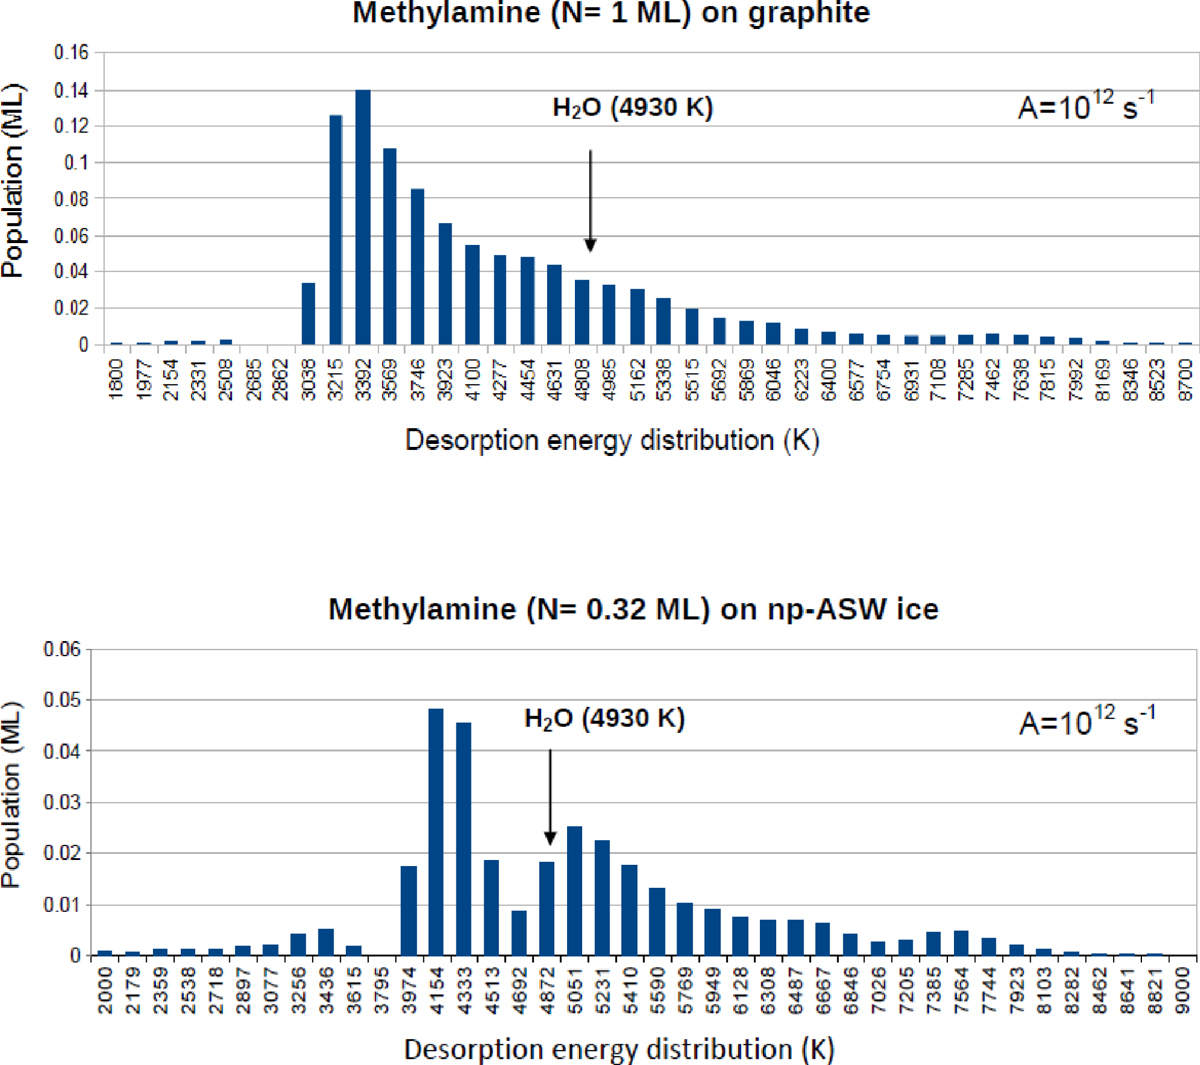
Modelling results of the desorption energy distributions (K) of methylamine on
graphite (HOPG) and np-ASW ice surfaces. Top panel: surface population (ML) of
CH3 NH2
(m∕z = 31)
as a functionof the desorption energy (K) for an exposure dose N = 1 ML
of CH3 NH2
on the HOPG surface. Bottom panel: surface population (ML) of NH2CH3
as a functionof the desorption energy (K) for an exposure dose N = 0.30 ML
of CH3 NH2
on the surface of the np-ASW ice film of 10 ML thickness, prepared at 110 K and cooled down to 40 K. The desorption
energy distribution (Ei)
and the surface population (Ni)
of methylamine are derived from Eq. (5) with the best pre-exponential factor
A = 1012 s−1
for the two exposure doses ![]() on HOPG and
on HOPG and ![]() on np-ASW ice surfaces.
on np-ASW ice surfaces.
Current usage metrics show cumulative count of Article Views (full-text article views including HTML views, PDF and ePub downloads, according to the available data) and Abstracts Views on Vision4Press platform.
Data correspond to usage on the plateform after 2015. The current usage metrics is available 48-96 hours after online publication and is updated daily on week days.
Initial download of the metrics may take a while.