Fig. 5
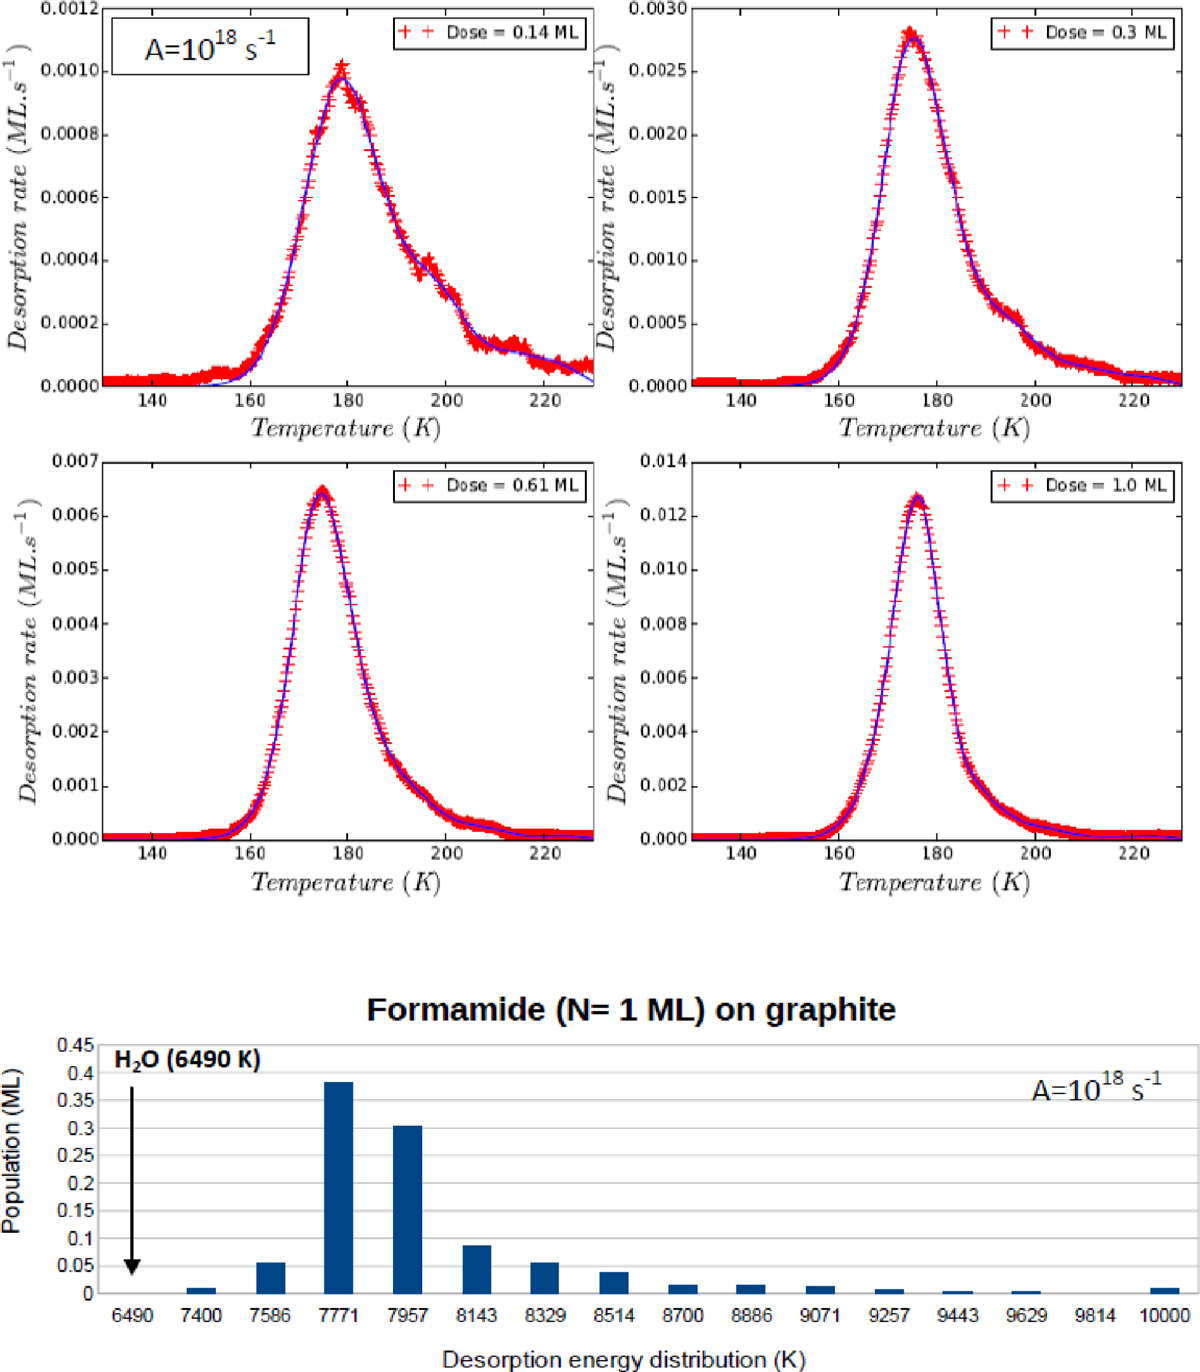
Modelling results of the desorption rates (ML s−1)
and the desorption energy distribution (K) of formamide on graphite (HOPG) surface. Top panel: red crosses indicate TPD
data of NH2CHO
(m∕z = 45)
on HOPG surface for different exposure doses of 0.14, 0.30, 0.61, and 1.0 ML; blue lines: the best fits of the TPD curves of
NH2CHO
from the HOPG surface, calculated with the pre-exponential factor A = 1018 s−1
are shown. Bottom panel: the surface population (ML) of NH2CHO
on HOPG surface as a function of the desorption energy (K) is shown. The desorption energy distribution
(Ei)
and the surface population (Ni)
of formamide are derived from Eq. (5) with the best pre-exponential factor
A = 1018 s−1
for the exposure dose ![]() .
.
Current usage metrics show cumulative count of Article Views (full-text article views including HTML views, PDF and ePub downloads, according to the available data) and Abstracts Views on Vision4Press platform.
Data correspond to usage on the plateform after 2015. The current usage metrics is available 48-96 hours after online publication and is updated daily on week days.
Initial download of the metrics may take a while.