Fig. 2
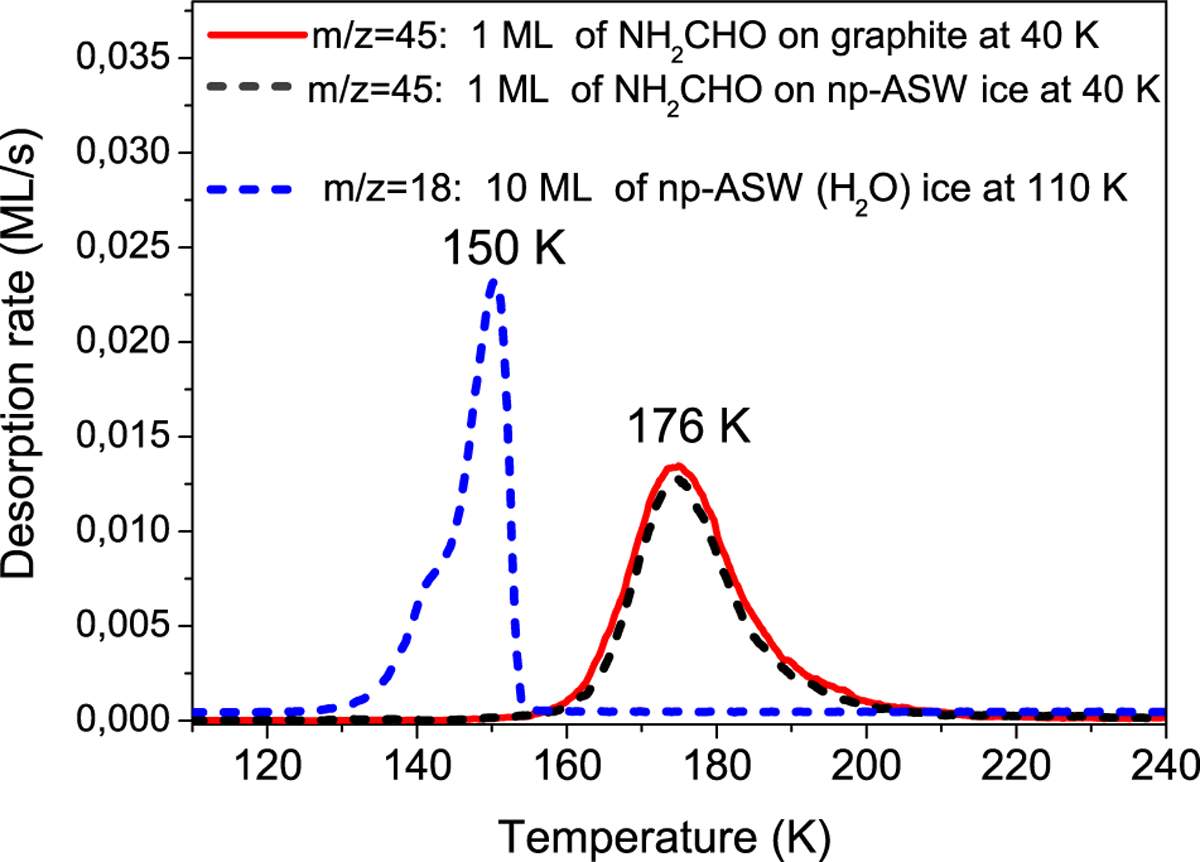
TPD curves of formamide (NH2CHO) giving the desorption rates (ML s−1) of the mass (m∕z = 45) as a function of the temperature of the surface (K). The red line indicates the TPD signal of NH2 CHO deposited on graphite (HOPG) surface at 40 K; the black dashed line shows the TPD signal of NH2 CHO deposited on the np-ASW ice surface at 40 K; and the blue dashed line indicates the TPD signal of H2 O (m∕z = 18) for 10 ML thickness of the np-ASW ice film prepared at 110 K on the HOPG surface and cooled down to 40 K (scaled by 0.0007).
Current usage metrics show cumulative count of Article Views (full-text article views including HTML views, PDF and ePub downloads, according to the available data) and Abstracts Views on Vision4Press platform.
Data correspond to usage on the plateform after 2015. The current usage metrics is available 48-96 hours after online publication and is updated daily on week days.
Initial download of the metrics may take a while.