Fig. A.1
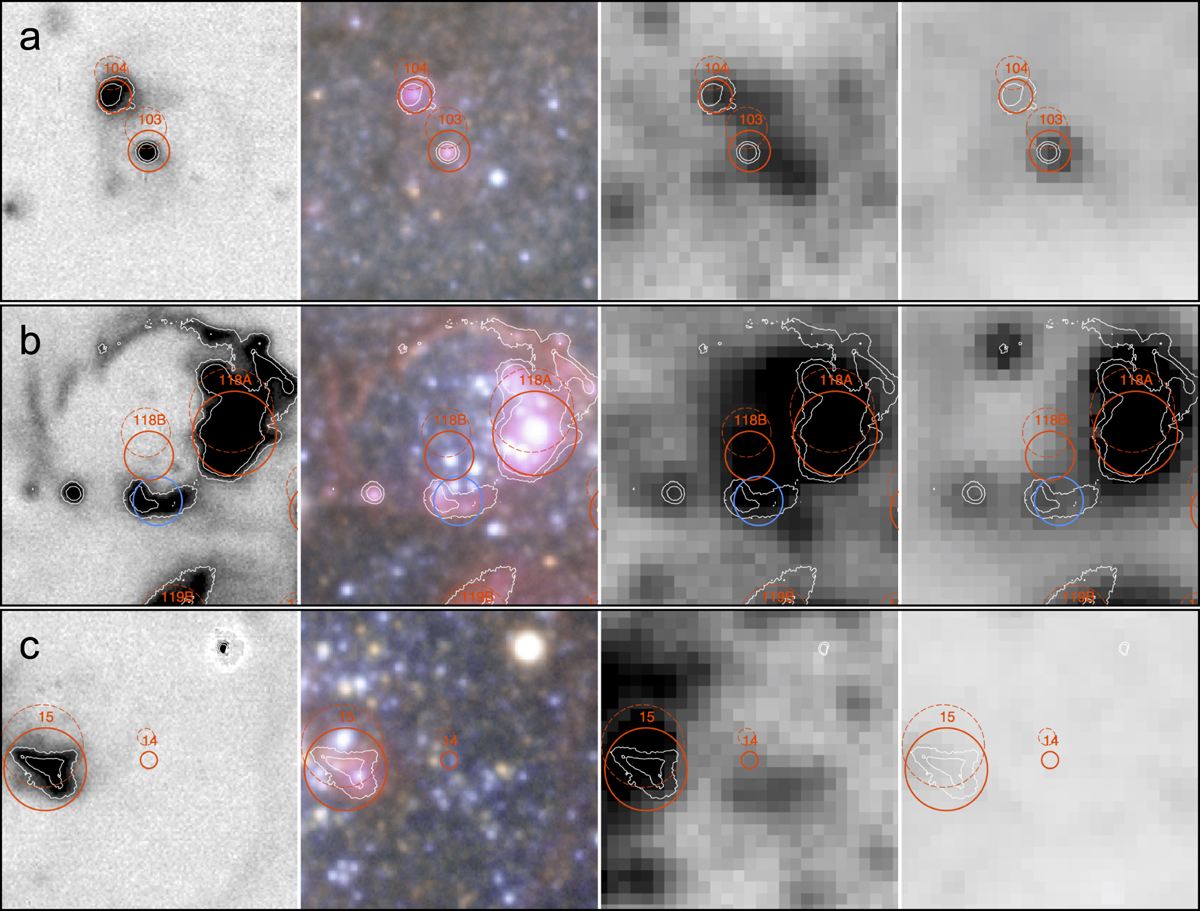
Leftto right: WFI Hα map (F14); ESO/WFI image (blue: 475 nm and OIII; green: 605 nm; orange: SII; red: Hα. Credit: ESO); GALEX FUV image; and Spitzer/MIPS 24 μm image. Panel a: Example of the astrometrical shift adopted for all HII regions. Panel b: Example of an additionallymanually shifted HII region. Red lines indicate the position of the source before (dashed) and after (solid) the general astrometric shift, the blue line indicates the final adopted position. Panel c: Example of a discarded HII region showing no analogues in the newer observations. White contours denote flux thresholds in Hα.
Current usage metrics show cumulative count of Article Views (full-text article views including HTML views, PDF and ePub downloads, according to the available data) and Abstracts Views on Vision4Press platform.
Data correspond to usage on the plateform after 2015. The current usage metrics is available 48-96 hours after online publication and is updated daily on week days.
Initial download of the metrics may take a while.