Fig. 7
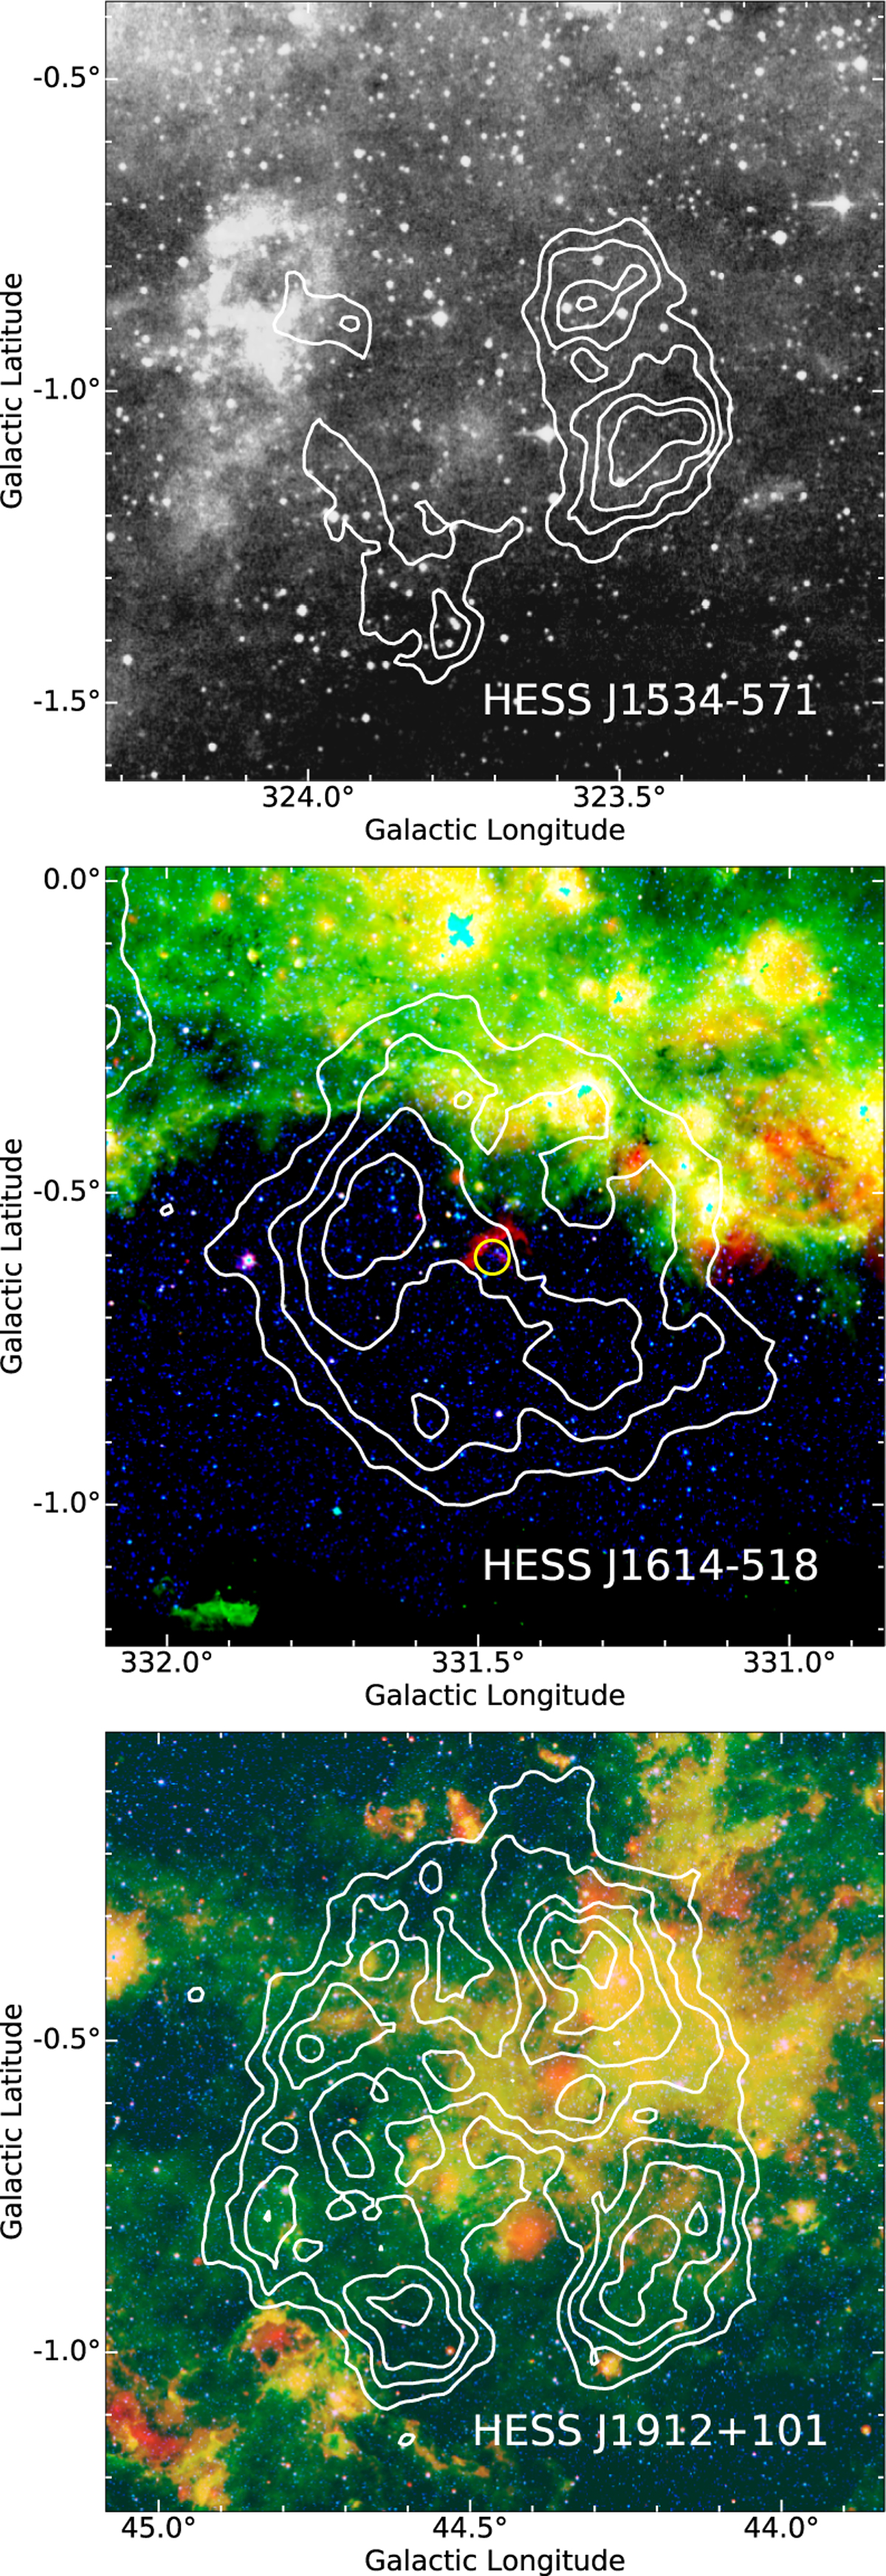
Archival infrared images toward the fields of the three TeV sources. Top panel: MSX (Price et al. 2001) image of the region toward HESS J1534-571, at 8.28 μm. Middle and bottom panels: three-color Spitzer images toward HESS J1614−518 and HESS J1912+101, respectively. Red, green, and blue colors indicate 24 μm (MIPSGAL, Carey et al. 2009), 8 μm, and 3.6 μm (GLIMPSE, Churchwell et al. 2009) emission, respectively. Color scales were adjusted individually to emphasize the structures in the images. Contours denote the TeV surface brightness of the respective source. The circle at the center of HESS J1614−518 denotes the position and extension of Pismis 22 (Morales et al. 2013).
Current usage metrics show cumulative count of Article Views (full-text article views including HTML views, PDF and ePub downloads, according to the available data) and Abstracts Views on Vision4Press platform.
Data correspond to usage on the plateform after 2015. The current usage metrics is available 48-96 hours after online publication and is updated daily on week days.
Initial download of the metrics may take a while.