Fig. 2
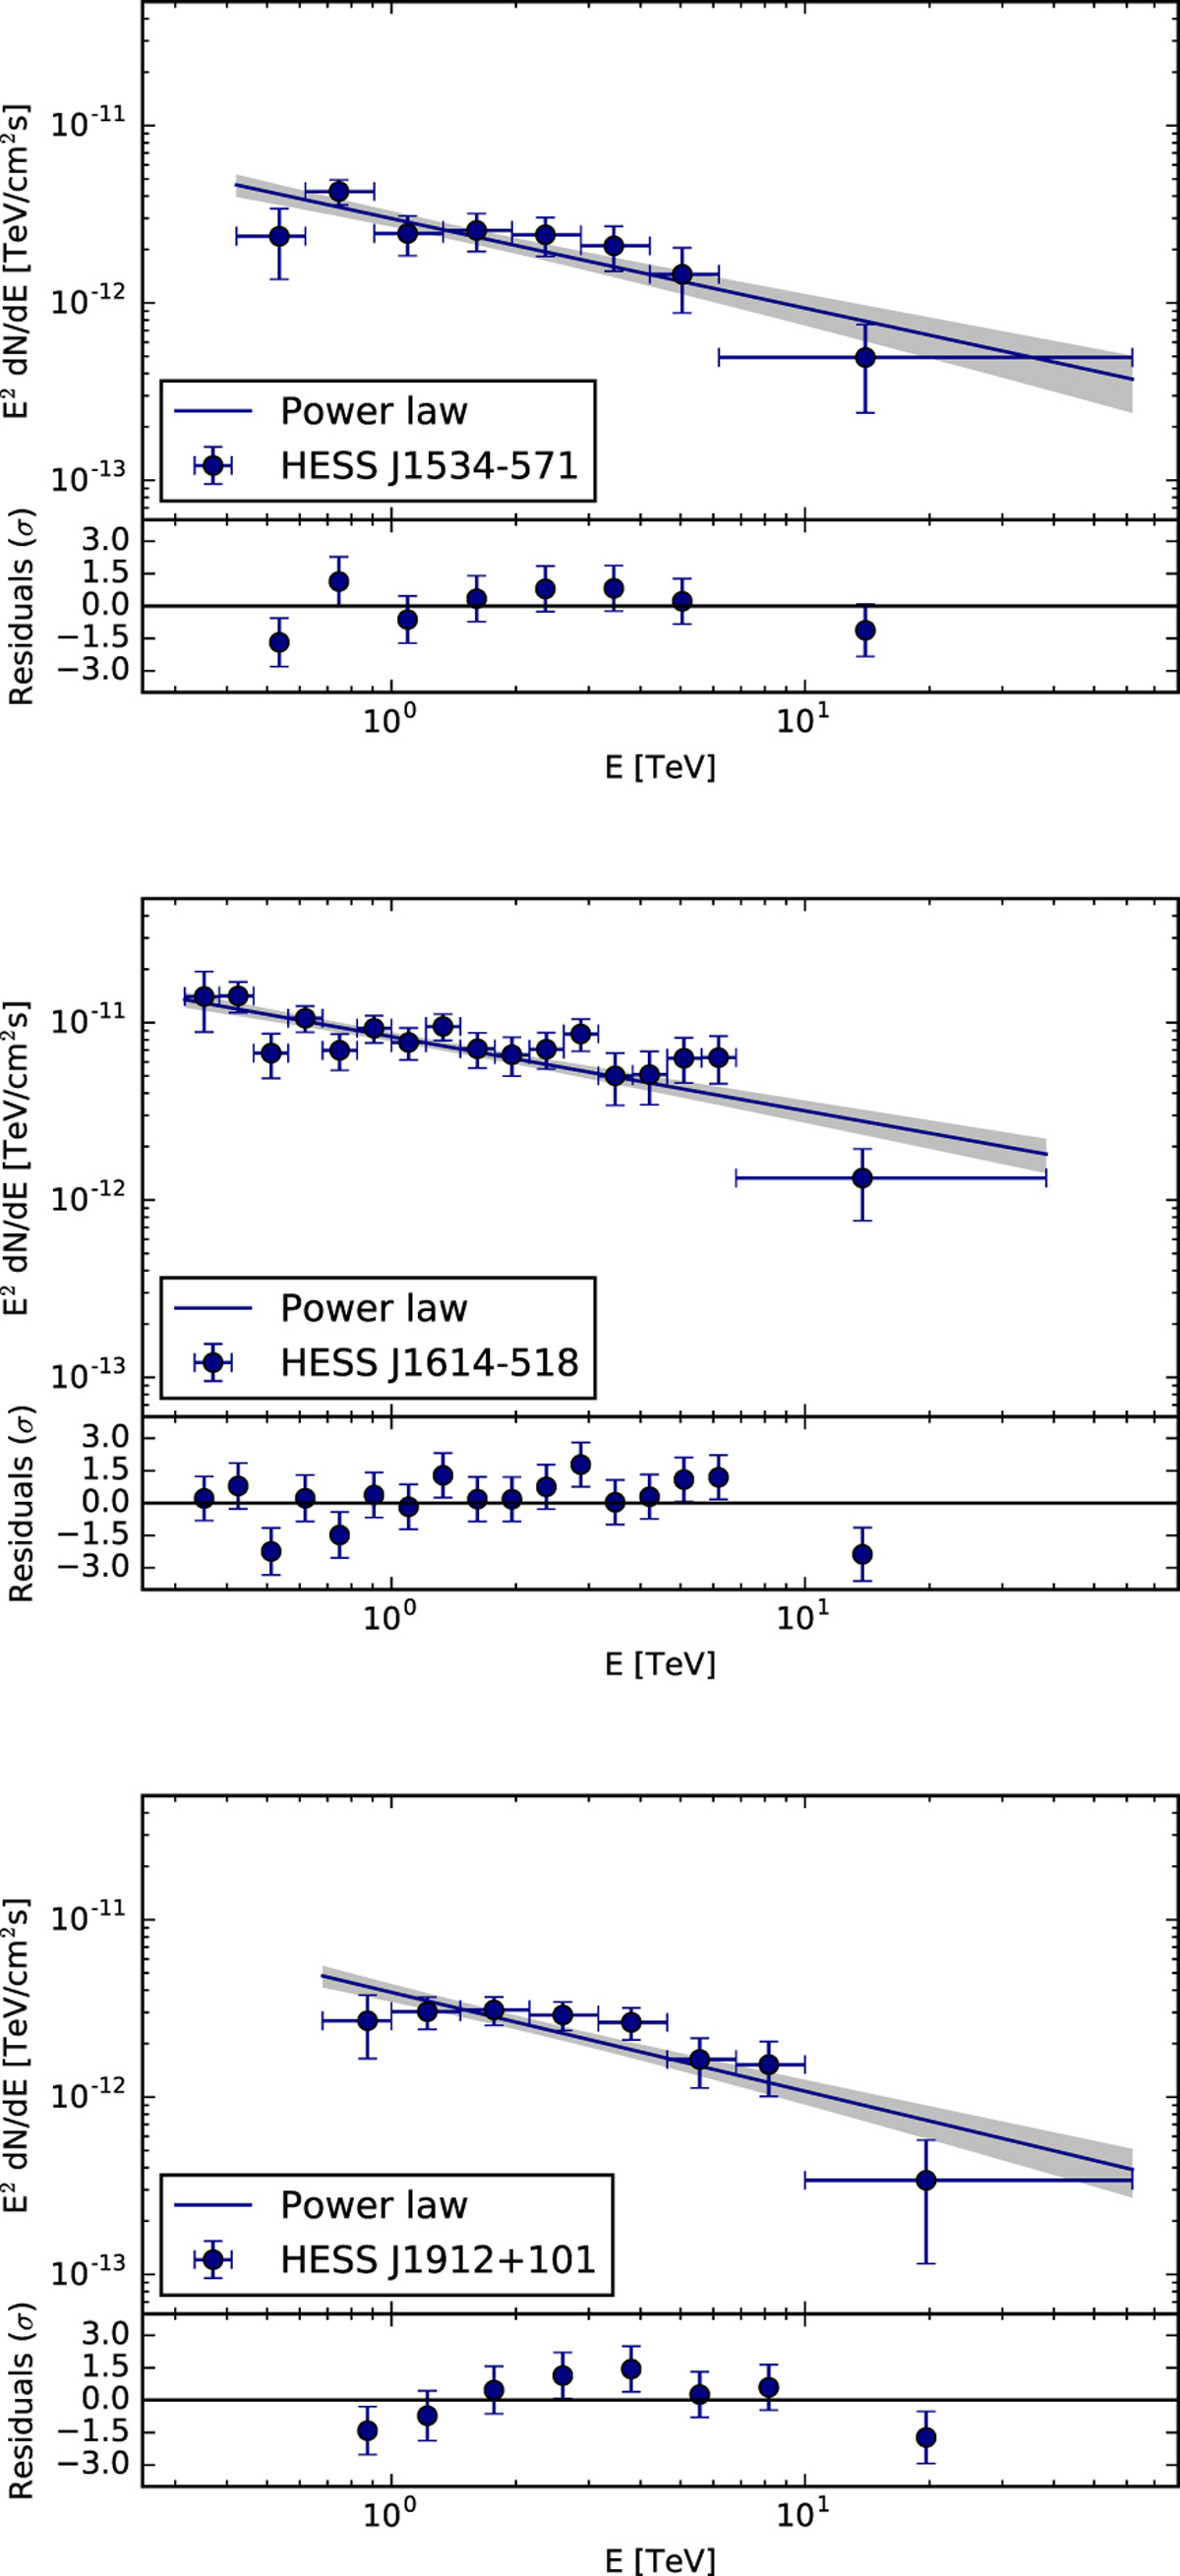
Upper boxes show the H.E.S.S. energy flux spectra of HESS J1534−571, HESS J1614−518, and HESS J1912+101 (blue data points with 1 σ statistical uncertainties), respectively. The bin size is determined by the requirement of at least 2σ significance per bin. The solid blue lines with the gray butterflies (1 σ error of the fit) show the best fit power-law models from Table 4. The Bottom boxes show the deviation from the respective model in units of sigma, calculated as (F − Fmodel)∕σF. Systematic errors do not permit the application of more complex models to describe the data.
Current usage metrics show cumulative count of Article Views (full-text article views including HTML views, PDF and ePub downloads, according to the available data) and Abstracts Views on Vision4Press platform.
Data correspond to usage on the plateform after 2015. The current usage metrics is available 48-96 hours after online publication and is updated daily on week days.
Initial download of the metrics may take a while.