Fig. 9
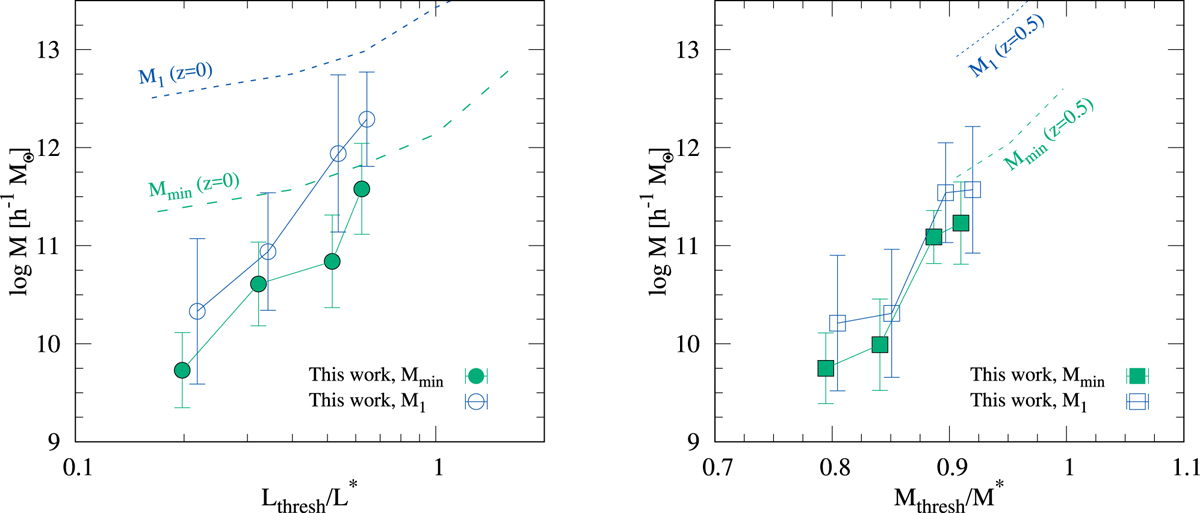
Characteristic halo masses from the best-fitting HOD models of the correlation function selected in luminosity vs. Lthresh∕L* (left panel) and selected in stellar mass vs. Mthresh∕M* (right panel). Minimum halo masses Mmin for which 50% of haloes host one central galaxy above the threshold limit (filled symbols) and masses of haloes which on average host one additional satellite galaxy M1 (open symbols) observed at z ~ 3 are compared with similar results found by Zehavi et al. (2011) at z ~ 0, for the luminosity selected galaxies, and by Skibba et al. (2015) at z ~ 0.5, for the stellar mass selected galaxies (dotted and dashed lines).
Current usage metrics show cumulative count of Article Views (full-text article views including HTML views, PDF and ePub downloads, according to the available data) and Abstracts Views on Vision4Press platform.
Data correspond to usage on the plateform after 2015. The current usage metrics is available 48-96 hours after online publication and is updated daily on week days.
Initial download of the metrics may take a while.