Fig. 8
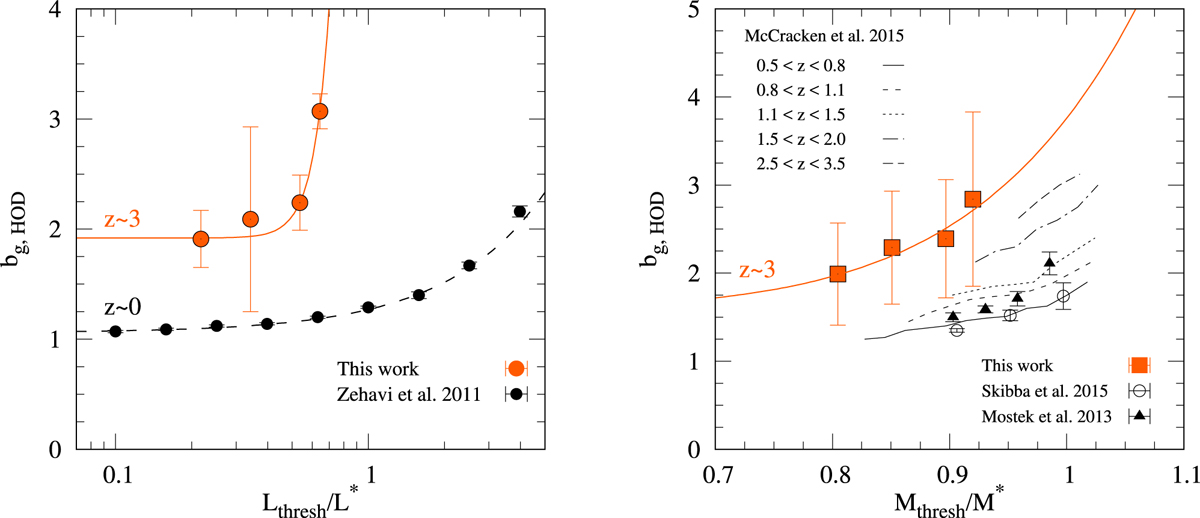
Large-scale galaxy bias bg,HOD as a functionof luminosity, with L* as a reference point (left panel) and as a function of stellar mass with M* as a reference point (right panel). In both plots, the coloured points indicate measurements at z ~ 3 from this work; the solid lines indicate the best-fit functions of the bias-luminosity dependence bg,HOD(>L) (Eq. (13)) and bias-stellar mass dependence bg,HOD(>M) (Eq. (14)) as described in Sect. 5.2. In the left panel, the black circles show the results from Zehavi et al. (2011) at z ~ 0 and the dashed line represents the empirical fit of the bias-luminosity dependence in the functional form given therein. In the right panel, we show for comparison the bg measurements at z ~ 0.5 from Skibba et al. (2015) represented by open circles, those at z ~ 1 by Mostek et al. (2013) are indicated by black triangles and from different samples in the redshift range 0.5 < z < 2.5 measured by McCracken et al. (2015) shown as black lines as labelled.
Current usage metrics show cumulative count of Article Views (full-text article views including HTML views, PDF and ePub downloads, according to the available data) and Abstracts Views on Vision4Press platform.
Data correspond to usage on the plateform after 2015. The current usage metrics is available 48-96 hours after online publication and is updated daily on week days.
Initial download of the metrics may take a while.