Fig. 7
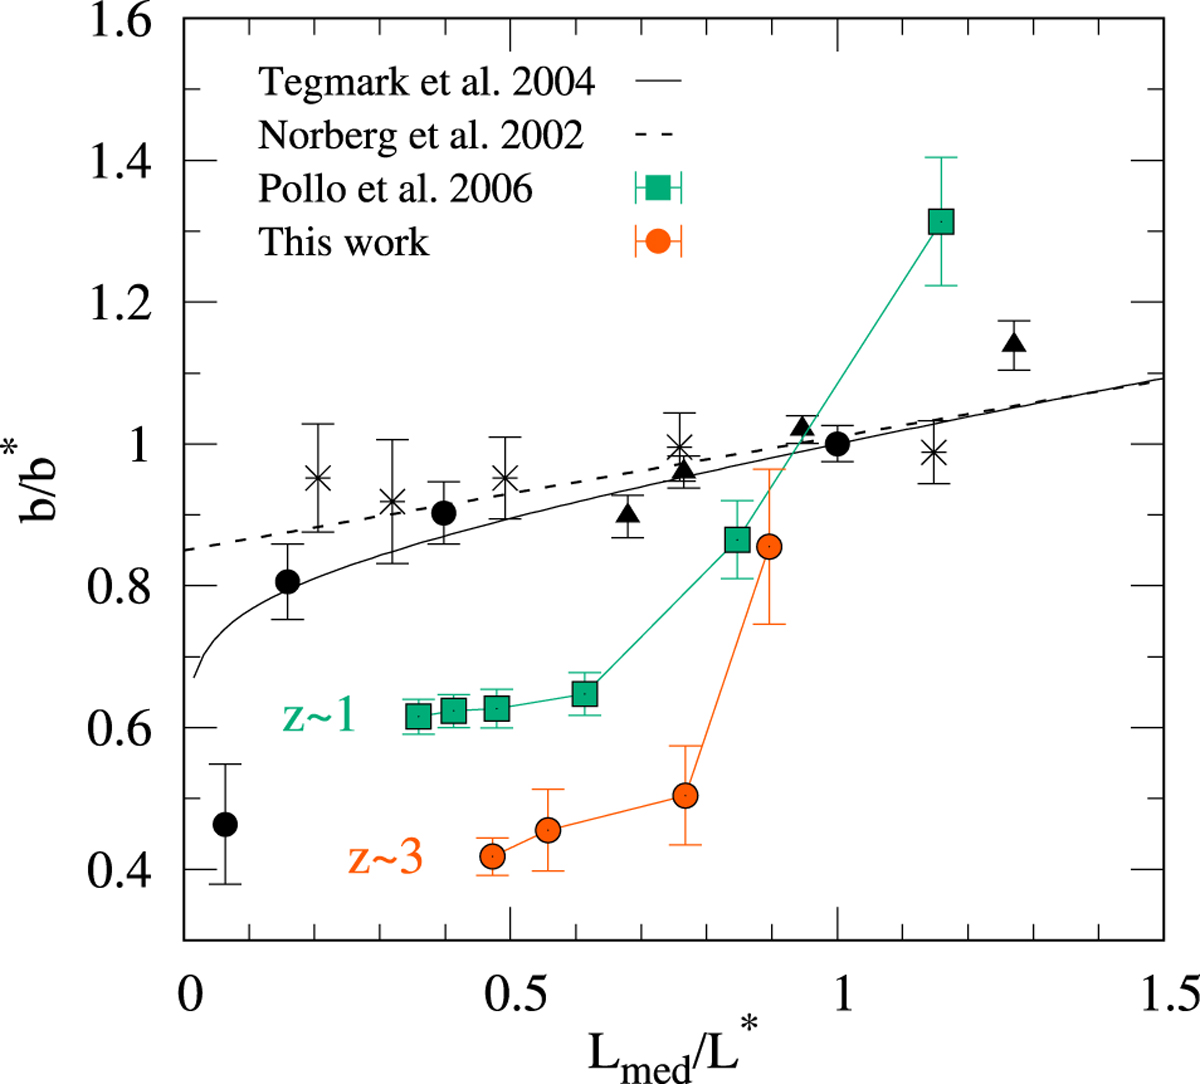
Relative bias b∕b* (see Eq. (12)) for the selected VUDS luminosity subsamples at z ~ 3 (orange circles) as a function of luminosity with L* as a reference point. The results from this work are compared to similar studies at lower redshift ranges: at z ~ 0.1 from Zehavi et al. (2011) (filled black circles) and Norberg et al. (2002) (black crosses), and at z ~ 0.9 from Pollo et al. (2006) (green circles). The lines indicate the analytic fit of the 2dFGRS data from Norberg et al. (2002) (black solid line) and SDSS data from Tegmark et al. (2004) (black dashed line), as described in the text.
Current usage metrics show cumulative count of Article Views (full-text article views including HTML views, PDF and ePub downloads, according to the available data) and Abstracts Views on Vision4Press platform.
Data correspond to usage on the plateform after 2015. The current usage metrics is available 48-96 hours after online publication and is updated daily on week days.
Initial download of the metrics may take a while.