Fig. 6
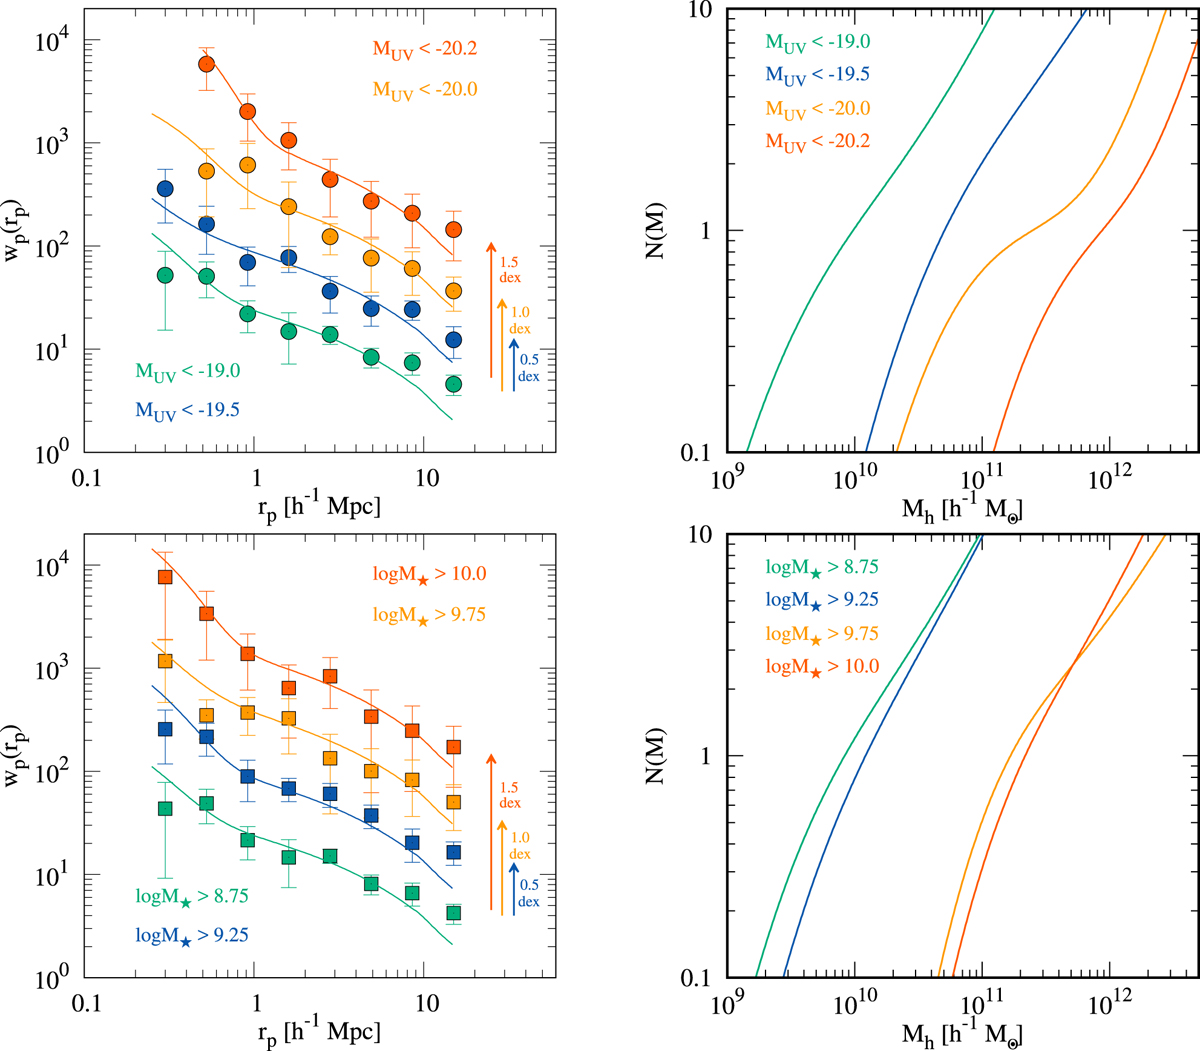
Projected two-point correlation function wp(rp) associated with the best-fitting HOD models (left side) and evolution of the halo occupation function of the best-fit HOD model (right side) in four UV absolute magnitude subsamples (upper panel) and four stellar mass subsamples (lower panel). The symbols and error bars (see Sect. 3 for the error estimation method) denote measurements of the composite correlation function for different luminosity (circles) and stellar mass (squares) subsamples selected from the VUDS survey in the redshift range 2 < z < 3.5. For clarity, offsets are applied to both the data points and best-fitting curves of the wp (rp), i.e. the values of wp(rp) and associated best fits for the galaxy subsamples with increasing luminosity and stellar masses were staggered by 0.5 dex each.
Current usage metrics show cumulative count of Article Views (full-text article views including HTML views, PDF and ePub downloads, according to the available data) and Abstracts Views on Vision4Press platform.
Data correspond to usage on the plateform after 2015. The current usage metrics is available 48-96 hours after online publication and is updated daily on week days.
Initial download of the metrics may take a while.