Fig. 3
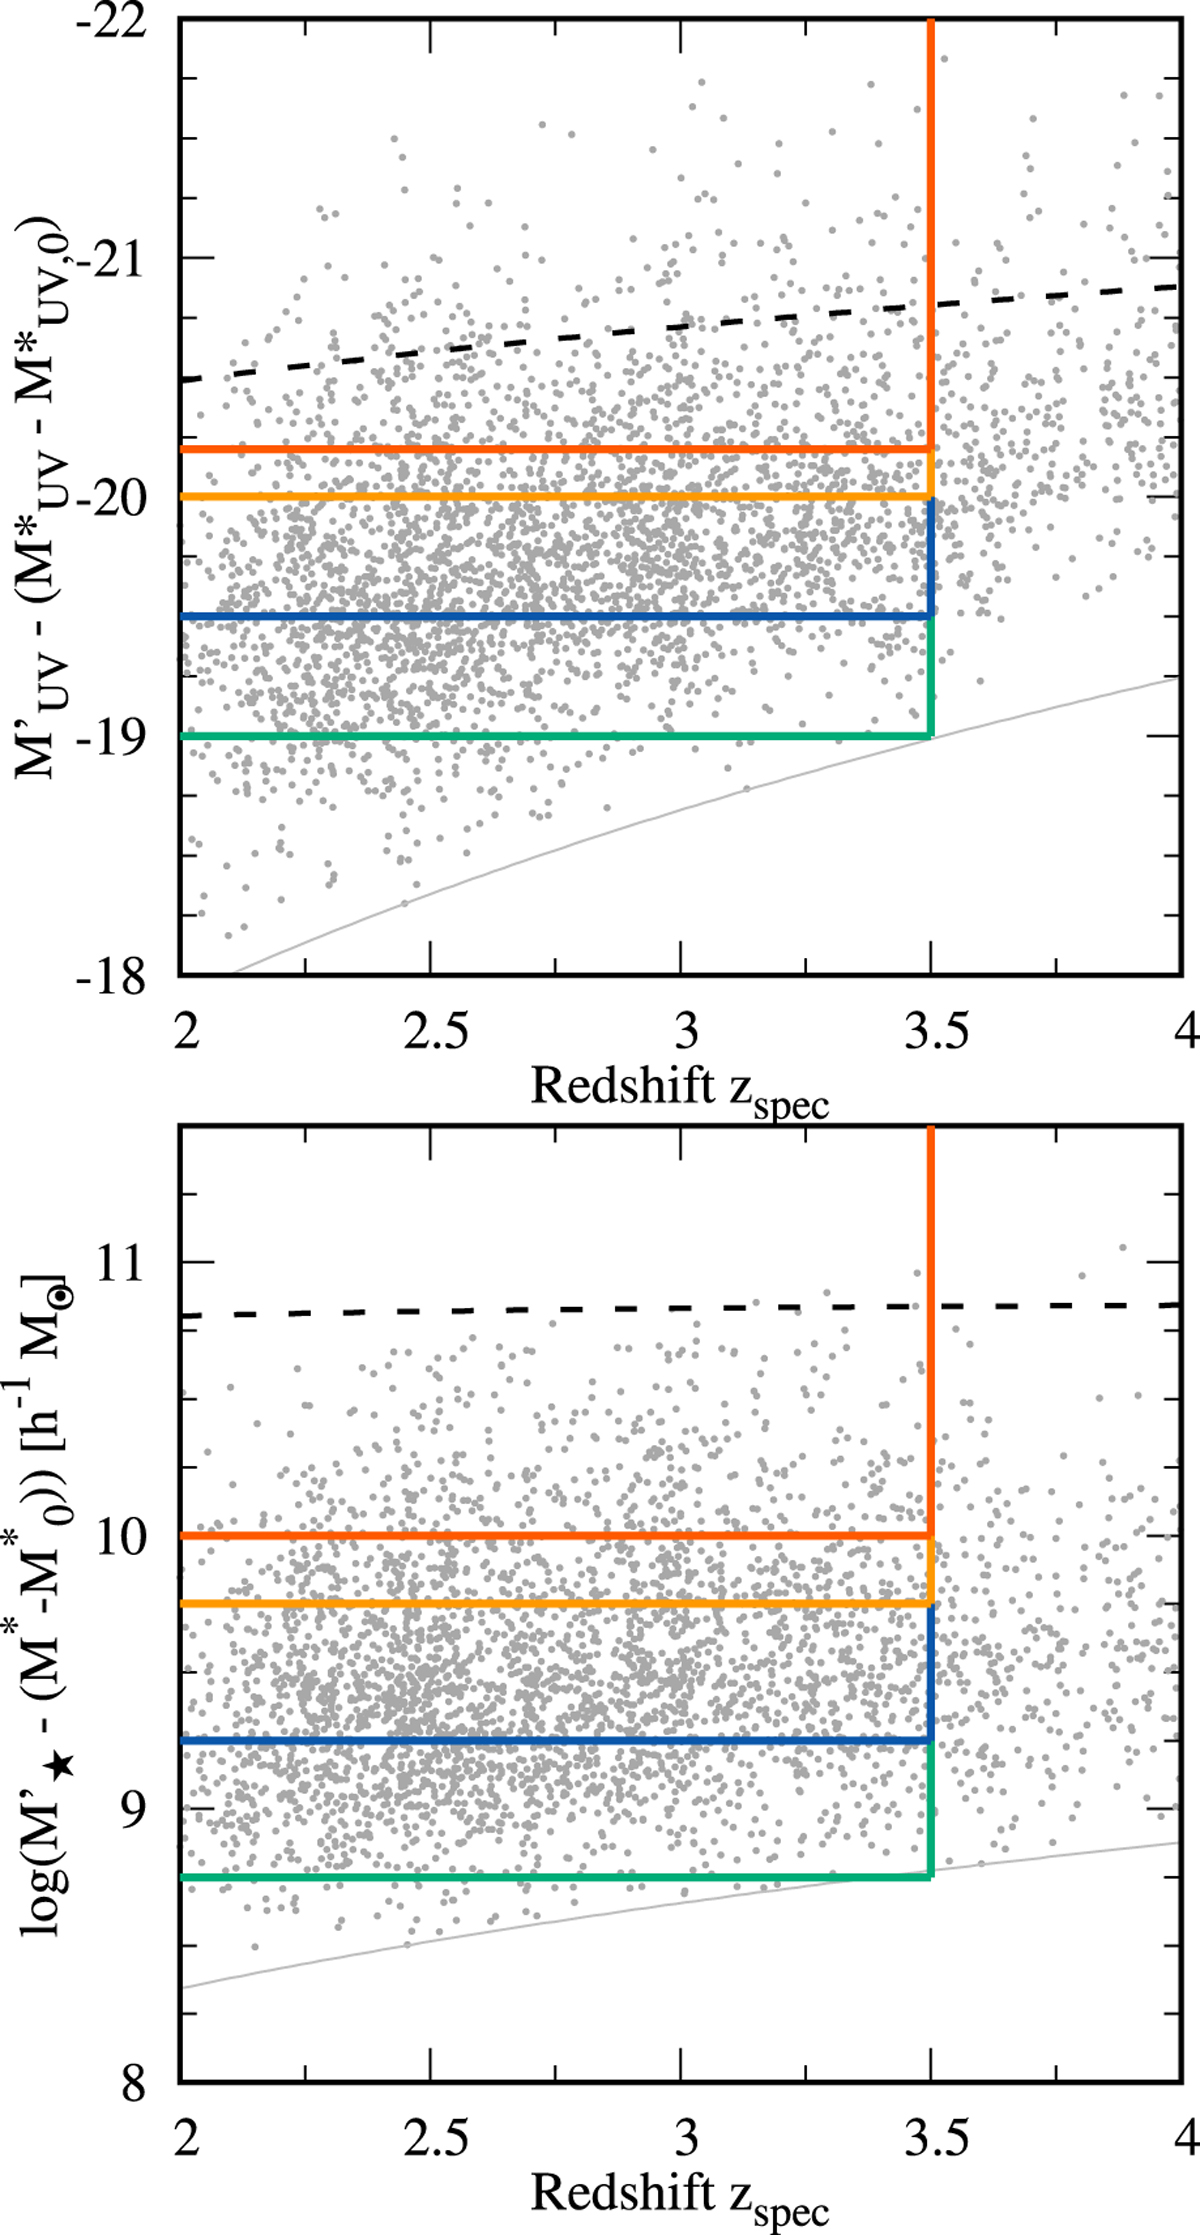
Construction of the volume-limited galaxy subsamples with different luminosity
(upper panel) and stellar mass (lower panel). In both figures the grey dots
represent the distribution of VUDS galaxies as a function of spectroscopic redshift
z.
At each redshift UV
band, absolute magnitudes and stellar masses are normalized to the characteristic absolute magnitudes or to the
characteristic stellar mass, respectively (see Sect. 2.2). The different colour lines delineate the selection cuts
for selected UV
absolute magnitude and stellar mass subsamples as defined in Tables 2 and
3. The dashed black line represents the evolution of the not corrected characteristic
UV
absolute magnitude ![]() (upper panel) or characteristic stellar mass M*
(lower panel). The grey line indicates the volume limit of the VUDS sample.
(upper panel) or characteristic stellar mass M*
(lower panel). The grey line indicates the volume limit of the VUDS sample.
Current usage metrics show cumulative count of Article Views (full-text article views including HTML views, PDF and ePub downloads, according to the available data) and Abstracts Views on Vision4Press platform.
Data correspond to usage on the plateform after 2015. The current usage metrics is available 48-96 hours after online publication and is updated daily on week days.
Initial download of the metrics may take a while.