Fig. A.1
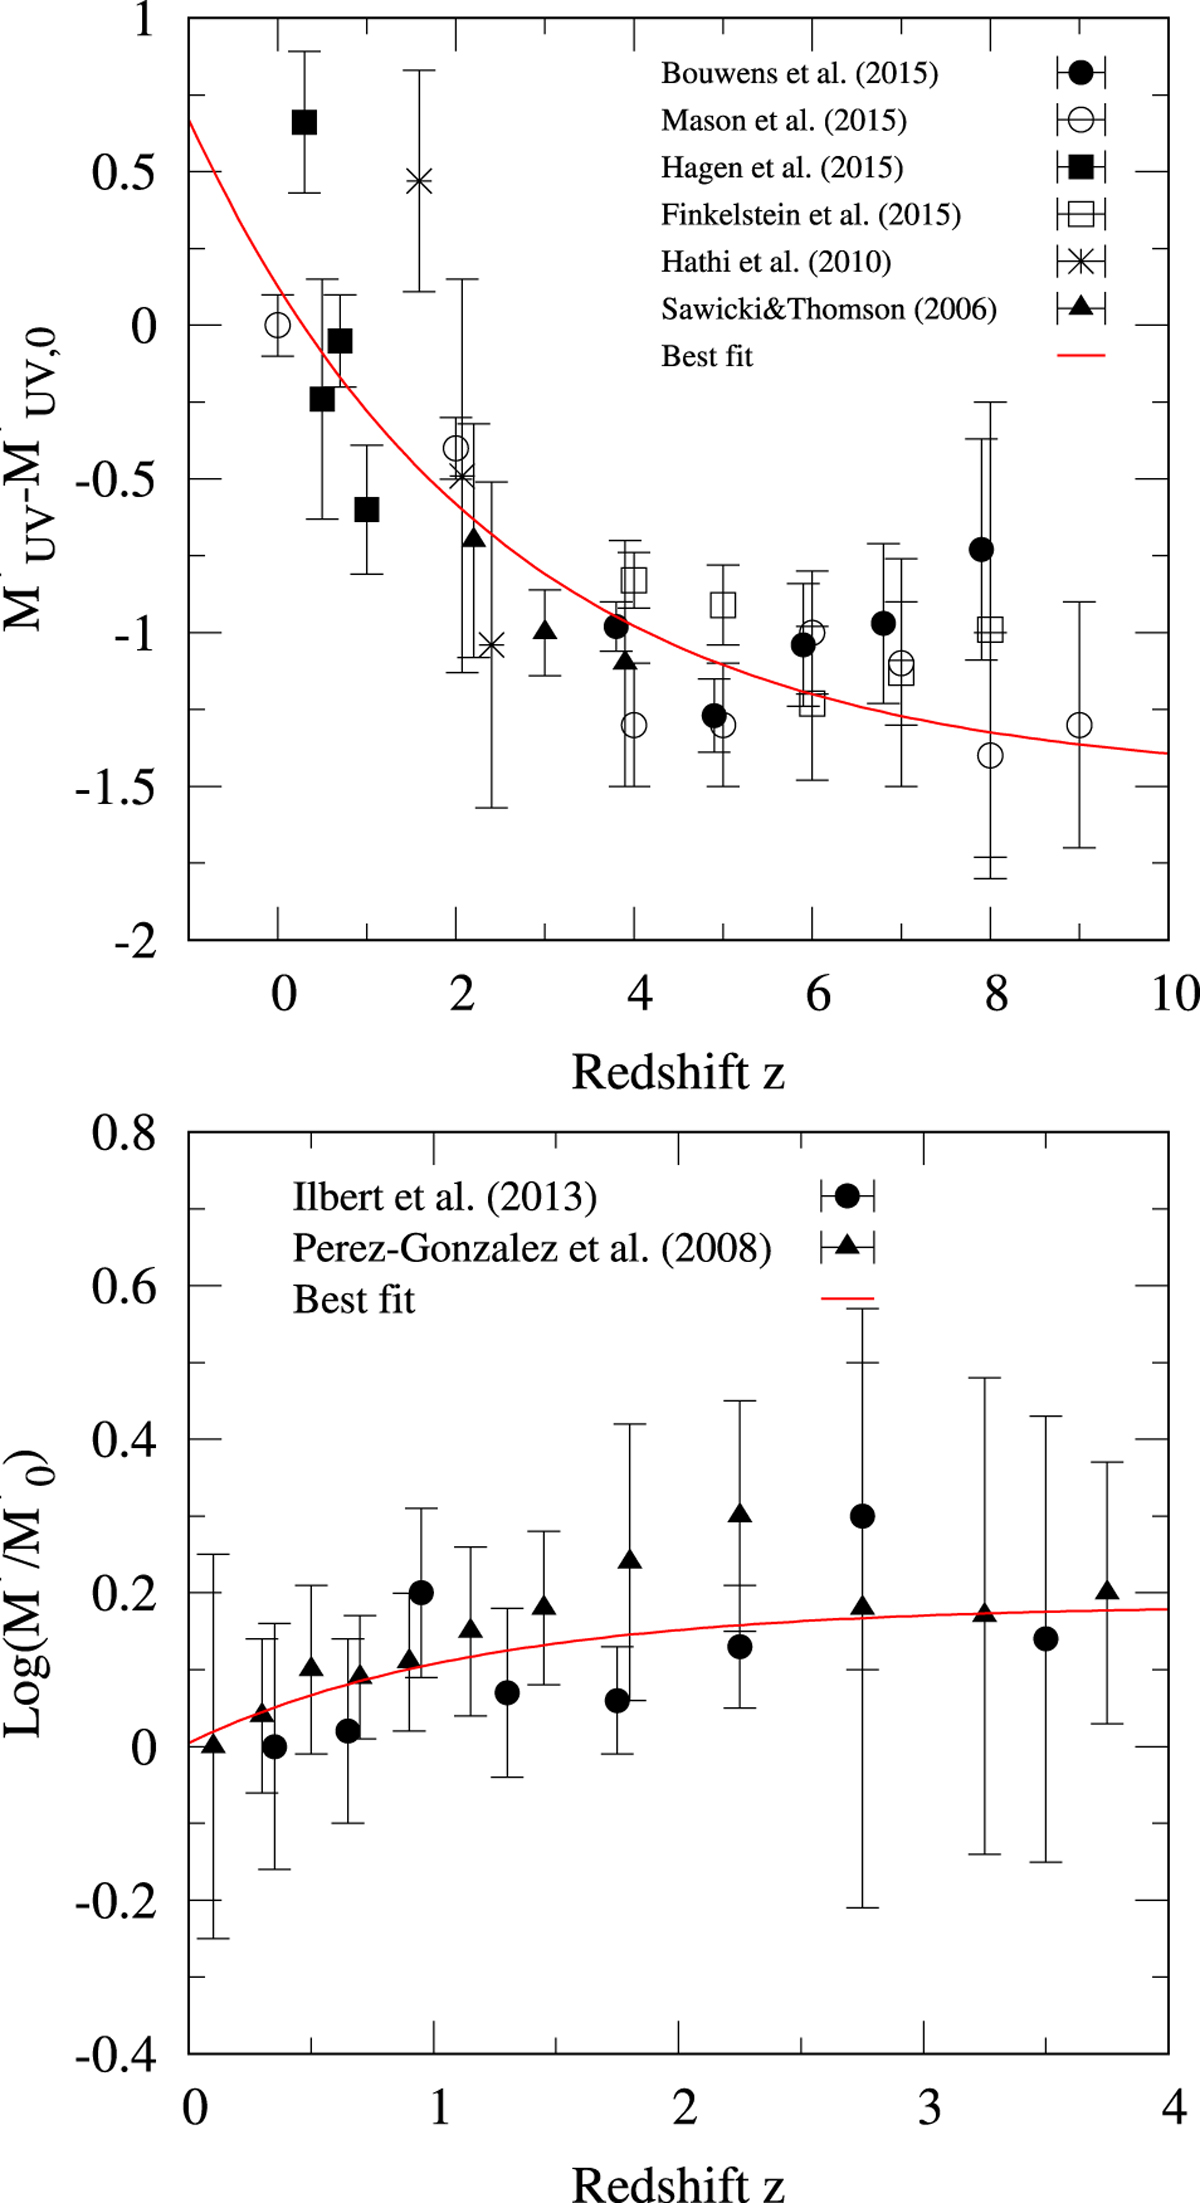
Compilation of the values of Schechter characteristic UV
galaxy luminosity ![]() (upper panel) and Schechter characteristic stellar mass
(upper panel) and Schechter characteristic stellar mass ![]() (lower panel). The symbols represent the measurements taken from various works (Bouwens et al. 2015; Mason et al. 2015; Hagen et al. 2015; Finkelstein et al. 2015; Ilbert et al. 2013; Hathi et al. 2010; Pérez-González et al. 2008; Sawicki & Thompson 2006) as described in the legend. In each plot the solid red line shows the best-fitting
exponential function given by Eqs. (A.1) and (A.2) for the upper and lower panel, respectively.
(lower panel). The symbols represent the measurements taken from various works (Bouwens et al. 2015; Mason et al. 2015; Hagen et al. 2015; Finkelstein et al. 2015; Ilbert et al. 2013; Hathi et al. 2010; Pérez-González et al. 2008; Sawicki & Thompson 2006) as described in the legend. In each plot the solid red line shows the best-fitting
exponential function given by Eqs. (A.1) and (A.2) for the upper and lower panel, respectively.
Current usage metrics show cumulative count of Article Views (full-text article views including HTML views, PDF and ePub downloads, according to the available data) and Abstracts Views on Vision4Press platform.
Data correspond to usage on the plateform after 2015. The current usage metrics is available 48-96 hours after online publication and is updated daily on week days.
Initial download of the metrics may take a while.