Fig. 5
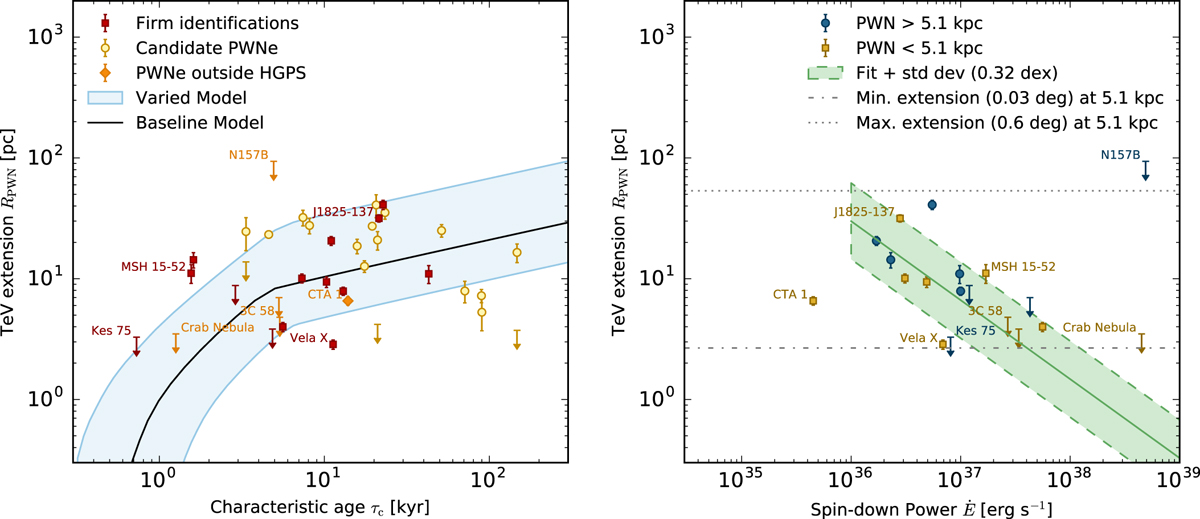
Left: PWN extension evolution with time, in comparison to the modelling considered in this work. Right: PWN extension evolution with Ė, as fitted in the RPWN(Ė) column of Table 6 for pulsar wind nebulae with Ė > 1036 erg s-1 (see Sect. 5.2.1). The shaded range shows the fit range and standard deviation σlg R . 1 dex refers to an order of magnitude and is the unit of the logspace defined σlg Y . For clarity, this plot excludes PWN candidates and divides the sample into nearby and far pulsar wind nebulae to illustrate the potential selection or reconstruction bias (see text). The dot-dashed and dotted lines indicate the systematic minimum of 0.03° and the maximum measured extension in the HGPS of 0.6°, respectively, which are both projected to the average PWN distance of 5.1 kpc.
Current usage metrics show cumulative count of Article Views (full-text article views including HTML views, PDF and ePub downloads, according to the available data) and Abstracts Views on Vision4Press platform.
Data correspond to usage on the plateform after 2015. The current usage metrics is available 48-96 hours after online publication and is updated daily on week days.
Initial download of the metrics may take a while.