Fig. 2
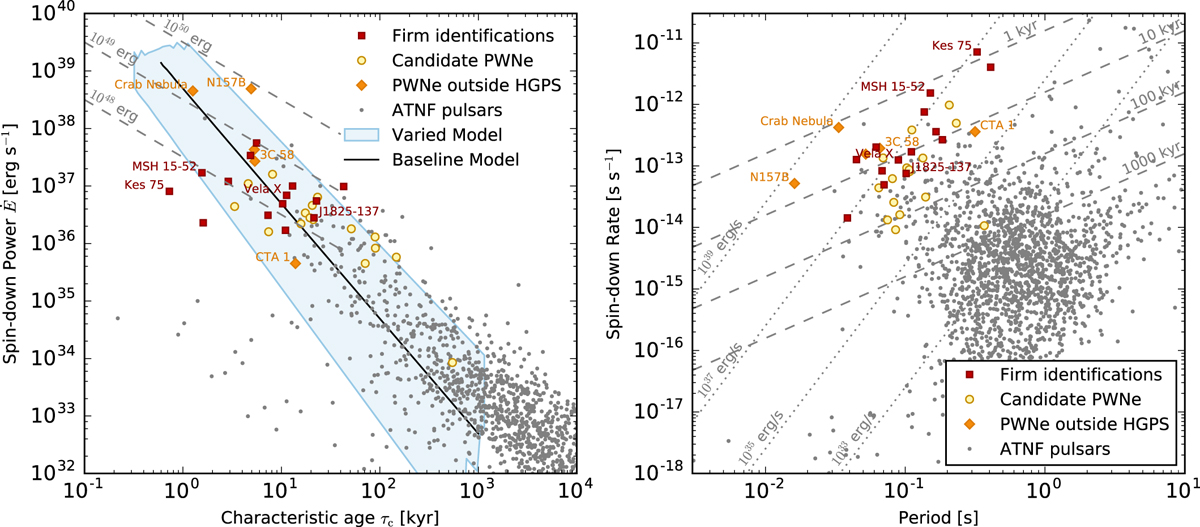
Left: spin-down power Ė and characteristic age τc of pulsars with a firmly identified PWN, candidate PWN, and without TeV counterpart (grey dots). The black line and shaded band show the injection evolution of the modelling used in this paper. The dashed lines indicate lines of constant total remaining energy Ė τ; see Appendix B. Hence a model curve that starts at Ė0τ0 = 1049 erg represents a pulsar with total initial rotational energy of 1049 erg. Since both Ė and τc depend on P and Ṗ , the axes in this plot do not represent independent quantities. Right: same data, shown in the commonly used view, using the independently measured P and Ṗ .
Current usage metrics show cumulative count of Article Views (full-text article views including HTML views, PDF and ePub downloads, according to the available data) and Abstracts Views on Vision4Press platform.
Data correspond to usage on the plateform after 2015. The current usage metrics is available 48-96 hours after online publication and is updated daily on week days.
Initial download of the metrics may take a while.