Fig. A.1
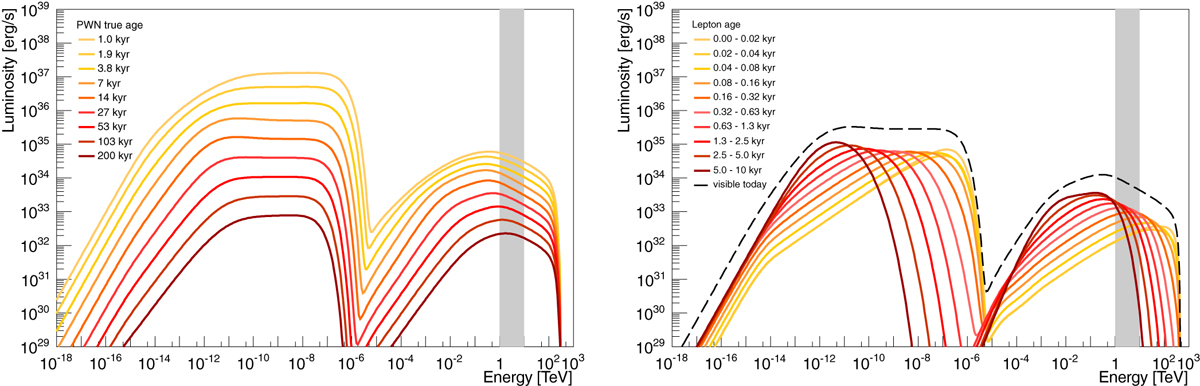
Modelled spectral energy distribution (SED) of a generic PWN with parameters according to baseline model given in Table A.1. See Appendix sectionlinking A.7 for caveats of the SEDs. Left: time evolution of the SED, ranging from 1 kyr to 200 kyr. Right: decomposition of the SED of a middle-aged PWN (10 kyr; black dashed curve) into contributions by leptons from various injection epochs (coloured lines). The grey-shaded bands indicate the energy range of 1–10 TeV explored in this paper.
Current usage metrics show cumulative count of Article Views (full-text article views including HTML views, PDF and ePub downloads, according to the available data) and Abstracts Views on Vision4Press platform.
Data correspond to usage on the plateform after 2015. The current usage metrics is available 48-96 hours after online publication and is updated daily on week days.
Initial download of the metrics may take a while.