Fig. 11
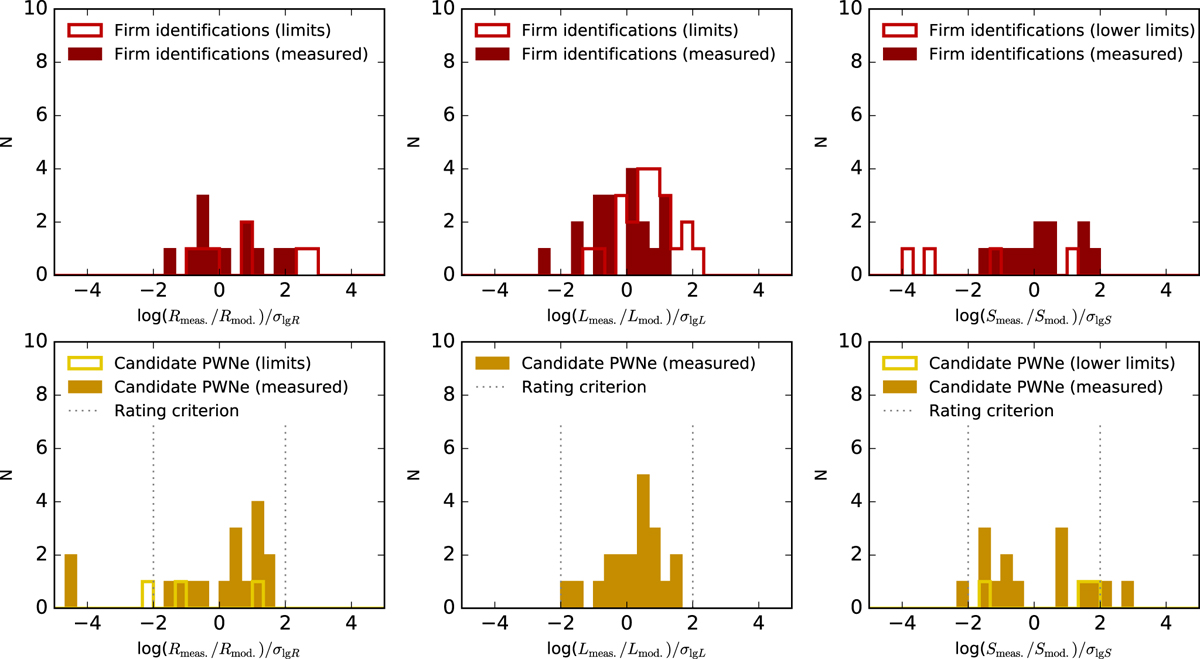
Common logarithmic residuals of rating criteria 2–4, using the standard deviations σlg Y explained in Sect. 6. Left: extension with respect to the model shown in Fig. 5 (left). Middle: same for luminosity (Fig. 7, left). Right: same for surface brightness (Fig. 10, left). In all cases, limits are shown separately as outlined histograms.
Current usage metrics show cumulative count of Article Views (full-text article views including HTML views, PDF and ePub downloads, according to the available data) and Abstracts Views on Vision4Press platform.
Data correspond to usage on the plateform after 2015. The current usage metrics is available 48-96 hours after online publication and is updated daily on week days.
Initial download of the metrics may take a while.