| Issue |
A&A
Volume 612, April 2018
|
|
|---|---|---|
| Article Number | A79 | |
| Number of page(s) | 30 | |
| Section | Galactic structure, stellar clusters and populations | |
| DOI | https://doi.org/10.1051/0004-6361/201527938 | |
| Published online | 30 April 2018 | |
Early phases in the stellar and substellar formation and evolution
Infrared and submillimeter data in the Barnard 30 dark cloud★
1
Depto. Astrofísica, Centro de Astrobiología (INTA-CSIC), ESAC Campus,
Camino Bajo del Castillo s/n,
28692
Villanueva de la Cañada, Spain
e-mail: This email address is being protected from spambots. You need JavaScript enabled to view it.
2
European Southern Observatory,
Alonso de Córdova 3107,
Vitacura, Santiago, Chile
3
Joint ALMA Observatory,
Alonso de Córdova 3107,
Vitacura, Santiago, Chile
4
Instituto de Física y Astronomía, Facultad de Ciencias, Universidad de Valparaíso,
Av. Gran Bretaña 1111,
Valparaíso, Chile
5
Millennium Nucleus “Núcleo Planet Formation”, Universidad de Valparaíso, Chile
6
Instituto de Radioastronomía y Astrofísica, Universidad Nacional Autónoma de México,
P.O. Box 3-72,
58090
Morelia,
Michoacán, Mexico
7
Depto. de Astronomía, Universidad de Chile,
Camino del Observatorio 1515,
Santiago, Chile
8
European Space Astronomy Centre (ESA),
Camino Bajo del Castillo s/n,
28692
Villanueva de la Cañada, Madrid, Spain
9
Institute of Astronomy and Astrophysics, Academia Sinica,
11F of AS/NTU Astronomy-Mathematics Building, No. 1, Sec. 4, Roosevelt Rd,
Taipei
10617, Taiwan
10
Spitzer Science Center, California Institute of Technology,
Pasadena,
CA
91125, USA
11
Depto. Física Teórica, Fac. de Ciencias, Universidad Autónoma de Madrid,
Campus Cantoblanco,
28049
Madrid, Spain
12
Unidad Asociada UAM-CAB/CSIC,
Madrid, Spain
13
Space Telescope Science Institute,
3700 San Martin Dr.,
Baltimore,
MD
21218, USA
Received:
9
December
2015
Accepted:
11
November
2017
Abstract
Aims. The early evolutionary stage of brown dwarfs (BDs) is not very well characterized, especially during the embedded phase. Our goal is to gain insight into the dominant formation mechanism of very low-mass objects and BDs.
Methods. We have conducted deep observations at 870 μm obtained with the LABOCA bolometer at the APEX telescope in order to identify young submillimeter (submm) sources in the Barnard 30 dark cloud. We have complemented these data with multi-wavelength observations from the optical to the far-IR and compiled complete spectral energy distributions in order to identify the counterparts, characterize the sources and to assess their membership to the association and stellar or substellar status based on the available photometric information.
Results. We have identified 34 submm sources and a substantial number of possible and probable Barnard 30 members within each individual APEX/LABOCA beam. They can be classified into three distinct groups. First, 15 of these 34 have a clear optical or IR counterpart to the submm peak and nine of them are potential proto-BD candidates. Moreover, a substantial number of them could be multiple systems. A second group of 13 sources comprises candidate members with significant infrared excesses located away from the central submm emission. All of them include BD candidates, some displaying IR excess, but their association with submm emission is unclear. In addition, we have found six starless cores and, based on the total dust mass estimate, three might be pre-substellar (or pre-BDs) cores. Finally, the complete characterization of our APEX/LABOCA sources, focusing on those detected at 24 and/or 70 μm, indicates that in our sample of 34 submm sources there are, at least: two WTTs, four CTTs, five young stellar objects, eight proto-BD candidates (with another three dubious cases), and one very low luminosity objects.
Conclusions. Our findings provide additional evidence concerning the BD formation mechanism, which seems to be a downsized version of the stellar formation.
Key words: binaries: close / brown dwarfs / stars: pre-main sequence / stars: protostars / open clusters and associations: general / open clusters and associations: individual: Barnard 30 dark cloud
Tables 3–7 and reduced images (FITS files) are only available at the CDS via anonymous ftp to cdsarc.u-strasbg.fr (130.79.128.5) or via http://cdsarc.u-strasbg.fr/viz-bin/qcat?J/A+A/vol/page
© ESO 2018
1 Introduction
The Barnard 30 dark cloud (B30, hereafter) is located at the rim of the Lambda Orionis star forming region (Murdin & Penston 1977), a complex structure at about 400 pc, which gives shape to the head of Orion. Although bright, massive stars usually dominate stellar associations, swarms of low-mass objects, much less conspicuous, can be found inside them. Our aim is to unveil this population and to focus on the early phases of low-mass evolution by analyzing this moderately nearby and very interesting dark cloud, whose star formation and shape seems to be triggered and/or controlled by the O8 III λ Orionis star (actually, a binary, Bouy et al. 2009) and perhaps by a supernova event which took place a few Myr ago (see Maddalena & Morris 1987; Cunha & Smith 1996; Dolan & Mathieu 2002).
Although the age of B30 is not very well constrained (it is normally given as 2–3 Myr), it is very likely significantly younger than the central cluster, Collinder 69 (C69, hereafter) whose nominal age is 5–8 Myr (Barrado y Navascués et al. 2004; Bayo et al. 2011). We note, however, that an older value has been proposed for C69 (10–12 Myr, Bell et al. 2013; Bayo et al. 2011). While there are no Class I objects in C69 (Barrado y Navascués et al. 2007), the ratio of Class I to Class II objects in B30 is 1:2 (Morales-Calderón 2008, based on a Spitzer/IRAC color–color diagram (CCD), Allen et al. 2004). This schematic classification is described in Lada (1987) and Adams et al. (1987) and it is based on the spectral energy distribution (SED) and interpreted in an evolutionary scenario. Therefore, B30 is an excellent hunting ground to find embedded stars and, if deep infrared surveys are conducted, substellar objects (i.e., brown dwarfs or BDs, quasi stellar objects unable to burn hydrogen at any evolutionary stage. For solar metallicity, the mass is lower than ~0.072 M⊙).
Dolan & Mathieu (1999, 2001, 2002) and Koenig et al. (2015) carried out an extensive search of young, low-mass stars in the Lambda Orionis star forming region, including optical imaging and medium resolution spectroscopy. Their initial photometric search was centered around the central, massive star λ Orionis (the C69 cluster), and near the dark clouds B30 and Barnard 35, located northwest and east from C69, respectively. In the first case, their photometric survey and subsequent spectroscopic confirmation (via radial velocity and lithium detection) allowed the identification of 266 stellar members in an area around these three groups. Among them, 63 can be considered members of the B30 dark cloud. In the case of Koenig et al. (2015), they identified 544 photometric stellar candidates in a 200 sq. deg area. A subsample of 175 was confirmed spectroscopically either by them or by previous studies, with a pollution rate less than 24%. Regarding the central cluster, Bayo et al. (2011) includes 172 spectroscopically confirmed members for C69, and a significant number of them are very well inside the BD domain. Now, our focus is the significantly younger B30 cloud.
As shown by the aforementioned studies, the B30 complex is in a very early stage of star formation, and becomes an excellent testbed to search for the most embedded low-mass objects and BDs. Recent studies suggest that the particular environmental conditions of a star forming cloud may play an important role in determining the outcome of very low-mass objects and BDs in that cloud (e.g., Levine et al. 2006; Scholz et al. 2013; Polychroni et al. 2013; Drass et al. 2016). In low-mass star forming regions, which typically form objects in groups or loose associations, the main BD formation mechanisms are turbulent fragmentation (Padoan & Nordlund 2004; Hennebelle & Chabrier 2008), and ejection from multiple protostellar systems and/or fragmented disks (Reipurth & Clarke 2001; Bate et al. 2002; Matzner & Levin 2005; Whitworth & Stamatellos 2006). However, in the surroundings of high-mass stars, where objects typically form more closely packed, there are additional plausible mechanisms, namely photo-evaporation of cores near massive stars (e.g., Hester et al. 1996; Whitworth & Zinnecker 2004), and gravitational fragmentation of dense filaments formed in a nascent cluster (e.g., Bonnell et al. 2008; Bate 2012), suggesting that these clustered regions bathed by the feedback from high-mass stars could show higher BD-to-star ratios. From the observational point of view, the study of the most embedded and youngest BDs requires the use of the millimeter or submillimeter (submm) regime, where they emit the bulk of their energy, as they are dominated by cold envelopes. Thus, it is necessary to conduct systematic multi-wavelength searches for BDs in clouds forming low-mass stars and also in clouds forming high-mass stars in closely packed environments.
Here we will mainly deal with four types of young objects. A young stellar object (YSO) contains an accreting hydrostatic core inside, whose final mass (after accretion and infall is finished) will be above 75 Mjup (i.e., will form a star). In the literature it is possible to find restricted definitions, so a YSO would be in the Class 0 or I stages. A more flexible definition includes all the evolutionary stages that the hydrostatic core takes before reaching the main sequence (i.e., Class 0, I, II and III). A proto-BD also contains an embedded accreting hydrostatic core inside, whose final mass (after accretion and infall is finished) will be in the range 13–75 Mjup. Thus, they are analogs to the Class 0/I protostars but in the substellar regime. An early phase would be a pre-BD, which is a dense core which will form a BD in a future but did not form an hydrostatic core yet (i.e., it is an analog to the “pre-stellar” cores for higher masses). Finally, a very low luminosity object (VeLLO) is a dense source with an accreting hydrostatic core inside, whose internal luminosity (Lint) is equal or below 0.1 L⊙. We note that all proto-BDs are VeLLOs, but not all VeLLOs are proto-BDs.
Several works have focused on the search for the youngest embedded BDs (proto-BDs), in different star forming regions. A number of VeLLOs have been identified as potential proto-BDs candidates (Young et al. 2004; di Francesco et al. 2007; Dunham et al. 2008). The first hydrostatic cores (FHCs), predicted by Larson (1969), might be classified as proto-BD candidates, since they are characterized by very low internal luminosities and very low masses, SEDs peaking at ~100 μm, and presence of low velocity outflows (e.g. Machida et al. 2008). To date, several FHCs have been identified (e.g. Onishi et al. 1999; Belloche et al. 2006a,b; Chen et al. 2010, 2012). However, the envelope masses of FHCs are too large so it seems unlikely that they will remain substellar (see Table 4 in Palau et al. 2014). Finally, observational studies using a multi-wavelength approach have provided several proto-BD candidates in different clouds and star forming regions (Barrado et al. 2009; Lee et al. 2009, 2013; Kauffmann et al. 2011; André et al. 2012; Palau et al. 2012, 2014; Morata et al. 2015; Liu et al. 2016; Riaz et al. 2016; de Gregorio-Monsalvo et al. 2016; Huélamo et al. 2017). Despite these efforts, the number of proto-BD candidates is still very small and the characterization incomplete.
In this work we present the results regarding a search of very young low-mass stars and BDs in one of the bright rims of the B30 dark cloud. The study is based on deep observations at 870 μm obtained with the LABOCA bolometer array, installed on the Atacama Pathfinder EXperiment (APEX1) telescope, complemented with multi-wavelength observations from the optical to the far-IR. The goal of the study is to gain insight into the dominant formation mechanism of very low-mass objects and BDs in this particular region of the Lambda Orionis star forming region. The data are described in Sect. 2, with a detailed description of the submm imaging (Sect. 2.1). The master catalog for all possible counterparts to our B30 submm sources is described in Sect. 2.6. In Sect. 3 we explain how we select cluster candidates from this list and discuss some individual cases in more detail. Section 4 summarizes the findings of this paper. A follow-up study based on ALMA observations is presented in Huélamo et al. (2017).
Summary of the instruments and photometry: beam size and pointing errors.
2 Observations and archival data
This work is focused on submm observations obtained with APEX/LABOCA at 870 μm. The region mapped by LABOCA (Fig. 1a) was selected based on the Spitzer nebulosity, as can be seen in Fig. 1b, where we display a Spitzer/MIPS image at 24 μm together with the APEX/LABOCA detections. This area contains a significant number of Class II objects (Morales-Calderón 2008; Bayo 2009). To complement the submm data, we have used both observations obtained by our group and data retrieved from public archives covering a broad wavelength range. These complementary observations are described in the following subsections, while their main characteristics (e.g. limiting magnitude, beam size, pointing accuracy) are summarized in Table 1.
2.1 APEX/LABOCA mapping at 870 μm
Continuum observations at 870 μm were carried out using APEX/LABOCA. The field of view (FOV) of the array is 11.4 arcmin, and the angular resolution of each beam is 18.6 ± 1 arcsec. APEX pointing errors, as quoted by the observatory2, are 2 arcsec, although our observations have smaller errors (see below).
Our data were acquired on 09–10 October 2008 within the Chilean program 082.F-0001B, under excellent weather conditions (zenith opacity values of 0.22 at 870 μm). Observations were performed using a spiral raster mapping centered on α = 05h31m18.96s, δ = +12°07′16.75″(J2000.0). This observing mode consists of a set of spirals with radii between 2 and 3 arcmin at a combination of nine and four raster positions separated by 60 arcsec in azimuth and elevation, with an integration time of 40 s per spiral. This mode provides a fully sampled and homogeneously covered map in an area of 15 × 15 arcmin. The total covered area has a quasi-circular shape with about 37 arcmin diameter. It represents about a 20–25% of the total projected size of the dark cloud, as seen by IRAS.
The total on source integration time was ~2.7 h. Calibration was performed using observations of Uranus as well as N2071R as secondary calibrator. The absolute flux calibration uncertainty is estimated tobe ~8%. The telescope pointing was checked every hour toward the source J0530+135, finding an rms pointing accuracy of ~1 arcsec, smaller than the nominal pointing accuracy (2 arcsec) and the range quoted by Weiß et al. (2009), 3–4 arcsec, which was estimated with a Monte Carlo simulation.
We reduced the data using the BoA and MiniCRUSH software packages (see Kovács 2008). The pre-processing steps consisted of flagging dead or cross-talking channels, frames with too high telescope accelerations and with unsuitable mapping speed, as well as temperature drift correction using two blind bolometers. The data reduction process includes flat-fielding, opacity correction, calibration, correlated noise removal (atmospherics fluctuations seen by the whole array, as well as electronic noise originated in groups of detector channels), and de-spiking. Every scan was visually inspected to identify and discard corrupted data. We used an optimized data processing to recover faint sources, which smoothed the map to a final angular resolution of 27.6 arcsec.
In total, we have detected 34 sources above a 4 σ detection threshold. The coordinates and the APEX/LABOCA fluxes at 870 μm are listed in Table 2. The APEX/LABOCA image of Barnard 30 is shown in Fig. 1a.
2.2 CAHA/Omega2000 near-IR
Deep near-IR data were acquired with the Omega2000 instrument at the CAHA 3.5 m telescope (Calar Alto Observatory in Spain3), an imager with a 15 × 15 arcmin FOV. We collected a ~1° × 1° grid in the J-band image, with a total 10 min exposure per pointing. The data were obtained in December 2007 (a large mosaic in the J filter) and 30 August 2011 (deep images in JHKs centered on the LABOCA pointing).
The initial data reduction was carried out with the “jitter” package from the eclipse library, version 5.0.0 (Devillard 1999, 1997), and involved flat field correction, bad pixel masking and frame combination. Typically, ten frames were available to combine, and we let jitter reject two to four frames per image to improve the final quality. The astrometry calibration was applied using Aladin with 2MASS as the reference catalog. Photometry was extracted using sextractor to detect the sources and to compute the aperture and PSF photometry for each detected object. An individual calibration was applied to each image, given the availability of 2MASS photometry. The process involves only zero point calibration, and we use well detected sources, with 2MASS magnitude not larger than 15 and quality flag A. The zero point error typically goes from 0.05 to 0.09 mag.
Due to their depth, our near-IR images include a very large number of detections. Based on the count number (see Fig. 2 for an example), the completeness and limiting magnitudes are Jcompl ~ 18.75 mag and Jlim ~ 20.5 mag in the case of the mosaic collected during December 2007. For the observations collected four years later, we have derived Jcompl ~ 19.25 mag, Hcompl ~ 18.25 mag, Kscompl ~ 16.25 mag; and Jlim ~ 21.50 mag, Hlim ~ 20.50 mag, Kslim ~ 18.25 mag. The complete information is listed in Table 1.
APEX/LABOCA sources in Barnard 30.
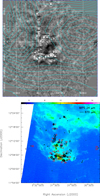 |
Fig. 1 Top: our APEX/LABOCA image, with the 34 sources at 870 μm. Black open circles correspond to the LABOCA identified sources, with a 27.6 arcsec beam size. The total size of the map is about 38 arcmin in diameter. The cyan lines represent the Hα emission (Virginia Tech Spectral line Survey with 6 arcmin resolution, Finkbeiner 2003). Bottom: color scale: MIPS image at 24 μm of B30. Black contours correspond to 3, 5, 7, 9, 12 and 15 times the rms noise of the 870 μm emission (which varies across the image and it increases toward the edge of the map). The 34 submm identified sources are marked with red labels. |
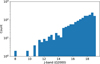 |
Fig. 2 Number of near-IR detections with CAHA/O2000 in the APEX/LABOCA FOV. The bin size has been estimated via the Freedman Diaconis Estimator (resilient to outliers). We estimate that the completeness limit is at Jcompl = 18.75 mag and the detection limit at Jlim = 20.5 mag. |
2.3 WFC optical imaging
Morales-Calderón (2008) provides a detailed description of all of the optical and mid-IR observational data we have obtained for the Lambda Orionis star forming region (including the B30 dark cloud) and our basic data reduction procedures. Here we provide just a brief summary.
The optical survey on the Barnard 30 association was performed on 24–26 December 2005 with the 2.5 m Isaac Newton Telescope at El Roque de los Muchachos Observatory (La Palma, Spain) and the Wide Field Camera4. Sloan-gunn r and i filters were used and four different pointings were observed covering the whole stellar cluster centered on Barnard 30. Short and long exposure times were used, in the first case, we exposed for 5 s in each filter whereas the long exposure times were 600 and 3 × 400 s for sloan-gunn i and r, respectively.
The weather during the run was clear and the mean seeing as measured in the images is 1.5 arcsec. The reduction and photometry was performed with the CASU INT Wide Field Survey pipeline (see Irwin & Lewis 2001, for more information on the pipeline). We used an aperture of five pixels, designed to match median seeing of our survey data and we have used the transformations provided by the ING to go from sloan-gunn magnitudes to Landolt (Johnson–Cousin’s). The final completeness magnitudes are Rcompl = 22.0 mag and Icompl = 20.5 mag.
2.4 Spitzer/IRAC and MIPS data
Our Spitzer5 data were collected on 22 October 2005 and 29 March 2006 with IRAC, and 2 March 2006 with MIPS as part of a General Observer cycle 2 program (PID:20339). The two epochs of IRAC imaging were obtained in mapping mode with individual exposures of 12 s frame time and three dithers at each map step. The high dynamic range option, which provides additional shorter (0.6 s frametime) exposures interleaved with the longer exposures, was used. Frames from the two epochs were co-added into one single deeper mosaic at each of the four bandpasses using the MOPEX package (Makovoz & Marleau 2005). The region with data in the four IRAC bandpasses covers ~0.6° × 1.2° and is centered at 05:31:22.77 + 12:14:52.35. The mean integration time for the deep mosaics is 62.4 s. MIPS data were obtained with fast rate scan mode and a total effective integration time per point on the sky of ~15 s. The mosaic covered an area of 1° × 2.4° centered around 05:30:23.17 + 11:55:52.83. Since there were no visible artifacts in the pipeline mosaic for MIPS 24 μm we used it as our starting point to extract the photometry.
Both source extraction and aperture photometry were done with IRAF. We used apertures of three pixels (3.66 arcsec) radius in the case of IRAC, and the sky was computed using a circular annulus four pixels wide, starting at a radius three pixels away from the center. For the MIPS data at 24 μm, we used a 5.31 pixels (13 arcsec) aperture and a sky annulus from 8.16 pixels (20 arcsec) to 13.06 pixels (32 arcsec). Aperture correction was applied in both cases. Details are summarized in Table 1 and are fully reported in Morales-Calderón (2008).
Since there is some structured nebulosity in the region and in order to verify that our detections are real we have visually inspected the location of every source in a median filtered mosaic (which has part of the diffuse emission filtered). We have also performed a psf fitting to make sure that each detection is consistent with a point source instead of just part of the nebulosity. To do that we used Spitzer/APEX tool within MOPEX to filter our mosaic with a high band pass filter. That removes the majority of the nebulosity. Then we searched that image for point sources and fitted a psf to them. Thus, when we were able to subtract a psf from the image and the filtered image showed a point source we kept those detections as real.
In some cases, the visual inspection of the filtered image indicated that a 24 μm source might not be real or could be strongly affected by the inhomogeneous extended emission. These values have been flagged with an asterisk in Table 3 and, although some of these detections might be real, the listed values should be used with some caveats.
The LABOCA FOV is not fully covered by the Spitzer/MIPS image at 70 μm (M2 band), which presents stripes with no data every 3 arcmin all along the north-to-south direction. We extracted the M2 photometry in all the LABOCA detections covered by this filter, and the fluxes are listed in Table 2. For the sources withMIPS M2 emission peaking inside the beam, we measured the flux inside an aperture of 30 arcsec of diameter (the LABOCA beam) centered on the core, and subtracted the background emission assessed in a nearby non-emitting region of the same area. For the sources with extended M2 emission we did not subtract the background as this cannot be easily assessed, and adopted this value as a conservative upper limit. The completeness and limiting magnitudes are: [3.6]compl = 17.5 mag, [4.5]compl = 17.0 mag, [5.8]compl = 15.0 mag, [8.0]compl = 14.5 mag, [24.0]compl = 8.5 mag; and [3.6]lim = 18.25 mag, [4.5]lim = 17.75 mag, [5.8]lim = 15.50 mag, [8.0]lim = 14.75 mag, [24.0]lim = 9.25 mag, when selecting objects with magnitudes with errors smaller than 0.15 mag (Table 1).
2.5 Public databases
We have also searched for photometric data in public archives. Among others, we have taken advantage of the tool implemented within Virtual Observatory SED Analyzer (VOSA6; Bayo et al. 2008, in prep.), under the Virtual Observatory protocols, and developed by the Spanish node7. See details below.
2.5.1 Akari mid- and far-IR data
The Japanese satellite Akari has provided an All-sky catalog in the mid- and far-IR by using two different instruments: IRC and FIS. Updated information can be found at the mission webpage8.
In the first case, comprehensive information about IRC can be found in Ishihara et al. (2010) and should be complemented with the mission release notes. Akari has provided fluxes in the S9W and L18W filters down to 50 and 90 mJy – IRC Release Note p. 29 (50 and 120 mJy nominal, 5σ detections). The effective beam size is 5.5 and 5.7 arcsec, respectively, and sources within 7 arcsec of each other are considered the same. Regarding the accuracy of the pointing (IRC Release Note p. 19), the latest value is 0.765 ± 0.574 arcsec. Moreover, 95% of the Akari/IRC detections are closer than 2 arcsec to the 2MASS counterparts (75% are closer than 1 arcsec).
In the case of the FIS instrument (Kawada et al. 2007), there are four different wide channels, namely N60 (65 μm), WIDE-S (90 μm), WIDE-L (140 μm) and N160 (160 μm). The 5σ limiting fluxes in survey mode are 2.4, 0.55, 1.4 and 6.3 Jy. Effective size of the point spread function of AKARI FIS in FWHM is estimated to be 37 ± 1 arcsec, 39 ± 1 arcsec, 58 ± 3 arcsec and 61 ± 4 arcsec at N60, WIDE-S, WIDE-L and N160. Finally, the pointing accuracy is 3.8 arcsec in RA (~cross-scan) and 4.8 arcsec in Dec (~inscan), as stated in the FIS Release Note p. 27.
2.5.2 WISE mid-IR photometry
We have also made use of the Wide-field Infrared Survey Explorer (WISE; Wright et al. 2010) and its latest version (AllWISE Data Release, 13 November 2013, Cutri et al. 2013). WISE has mapped the sky at 3.4, 4.6, 12 and 22 μm (W1, W2, W3 and W4) with an angular resolution of 6.1, 6.4, 6.5 and 12.0 arcsec (FWHM psf) in the four bands, achieving 5σ sensitivities better than 0.08, 0.11, 1 and 6 mJy in unconfused regions for point sources. The All-Sky Release includes all data taken during the WISE full cryogenic mission phase (7 January 2010 to 6 August 2010) and its postcryogenic phase (Mainzer et al. 2011). In addition, we ignored values with no errors, and also removed some data after a visual inspection, based on the significant source confusion.
2.5.3 Optical data from Dolan and Mathieu
We used the published data from Dolan & Mathieu (1999, 2002), which includes optical photometry in three bands down to completeness and detection limits, in the B30 area, of Vcompl = 18.5, Rcompl = 17.5, Icompl = 17.0 mag; and Vlim = 21.0, Rlim = 21.0 and Ilim = 19.0 mag. The data were calibrated with standards stars from Landolt (1992) and, therefore, the R and I photometry is tied to the Cousins system (Cousins 1976, also called as Kron–Cousins) and the V to the (Johnson 1963; see also Landolt 1973).
We note that several objects spectroscopically studied by Dolan & Mathieu (1999) are located within the APEX/LABOCA FOV, namely: DM114, 115, 118, 121, 125, 127, 131, 135, 136, 142, 143, 149, 152, 158, 164, 169 and 172. They are characterized by radial velocity compatible with membership to the Lambda Orionis star forming region and a lithium detection, a clear indication of youth for late spectral type stars. Only two among this group are close to our APEX/LABOCA sources, namely DM115 – inside LB33 – and DM142 – within LB20 (see Sects. A.3 and A.2, respectively). The others are not detected at 870 μm with APEX/LABOCA.
2.5.4 IRAS data
Two of our APEX/LABOCA detections have been identified with IRAS sources, namely B30-LB19 (IRAS 05286 + 1203) and B30-LB32 (IRAS 05293+1207), using a 25 arcsec radius search. The fluxes are listed in Table 2.
2.5.5 2MASS near-IR photometry
The All-Sky 2 MASS catalog (Cutri et al. 2003; Skrutskie et al. 2006) has completeness and limiting magnitudes, in the central region of the B30 dark cloud, of Jcompl ~ 16.65 mag, Hcompl ~ 15.95 mag, Kscompl ~ 15.45 mag; and Jlim ~ 18.95 mag, Hlim ~ 18.05 mag, Kslim ~ 17.45 mag. They have been used, among other things, to calibrate and complement our deep near-IR data.
2.5.6 Absorption map based on 2MASS
We have followed the approach in Cambresy et al. (1997) to derive an extinction map of the B30 sky area via an adaptive-step star count method. We used as base for the method the 2MASS all-sky point-source catalog (Skrutskie et al. 2006) as in López Martí et al. (2013). This technique, based in local density of stars as compared to an unobscured field at the same galactic latitude (in our case we use Collinder 69 as comparison field given its low and homogeneous extinction properties), provides an average resolution of 1.5′ across a region centered on 05:29:58.50 + 12:01:52.0 with 1.5° radius. The results, for each APEX/LABOCA detection, are listed in Table 2 and the conversion from AJ to AV follows Fitzpatrick (1999).
2.6 Cross-correlation and identifications
We have carried out a careful cross-correlation of the data taking into account both the errors in the pointing, which are not negligible in the case of APEX/LABOCA, and the beam size. The relatively wide beam sizes are very important when cross-matching detected sources at other wavelengths for Akari/FIS, Spitzer/MIPS, WISE (particularly W3 and W4) and APEX/LABOCA, and still significant for WISE W1 and W2, Akari/IRC and Spitzer/IRAC.
The beam size of APEX/LABOCA has an angular size of ~27.6 arcsec, so multiple identifications with optical, near- and mid-IR sources are possible. Since the grid pixel is about 4 arcsec, when searching for possible counterparts, we have assumed a 5 arcsec angular distance as the optimal counterpart search radius (at least for the non-extended sources). We note that some stars could have moved from their birth site, so the position of YSO could differ from the center of the submm emission. Jørgensen et al. (2008) have studied the correlation between MIPS and SCUBA data in Perseus and Ophiuchus and concluded that no significant dispersion has taken place if the formation is recent. In any case, we cannot completely rule out the possibility of a real offset due to a drift. In addition, we have visually inspected all possible cross-matches and in some cases rejected the WISE W3 and W4 due to confusion, as stated before. The results, including all possible identifications and the magnitudes at each filter, are listed in Tables 3 and 4 – near- and mid-IR photometry, Table 5 – optical plus 2MASS, and Table 6 – Akari data.
2.7 Classification of the LABOCA submm sources and the counterparts
We have cross-correlated the data from LABOCA with our catalogs of optical/IR sources. Based on the availability of data at 70 μm as a primary indicator and 24 μm as a secondary, we have classified the cross-matches into three groups, as listed in Table 2:
-
Group A. Sources detected at 70 μm. Depending whether they also have been detected at 24 μm they would belong to subgroup A1 or A2 (with or without measured flux at 24 μm, respectively).
-
Group B. Undetected sources at 70 μm (i.e., upper limits with Spitzer/MIPS M2). As in the previous case, we have differentiate whether they also have been detected at 24 μm: subgroups B1 ad B2 correspond to those with or without measured flux at 24 μm.
-
Group C. LABOCA sources outside the MIPS M2 FOV (i.e., no information at 70 μm, see Sect. 2.4). Some have been detected at 24 μm (subgroup C1) whereas others only display upper limits (subgroup C2).
This classification appears in Table 2. We have also included information regarding whether we classify the submm source as YSO (regardless of whether it is stellar or substellar), there are counterparts with IR excesses within the beam or the source seems to be a starless core; whether there is a potential substellar candidate (sometimes more than one) within the whole APEX/LABOCA beam; and whether there is a counterpart within 5 arcsec from the APEX/LABOCA emission peak (and whether it could be a BD). A detailed discussion can be found in Appendix A.
3 Properties of the submm APEX/LABOCA sources
3.1 Individual submm sources and an estimate of the emiting mass
We show the 870 μm LABOCA emission of the B30 dark cloud, together with the detected submm sources, in Fig. 1a. On top of the image we display the Hα nebular emission (Virginia Tech Spectral line Survey with 6 arcmin resolution, Finkbeiner 2003). Most of the detected sources are located in a “valley” in between the Hα peaks. Figure 1b corresponds to a Spitzer/MIPS1 image at 24 μm in colorscale, where the submm LABOCA sources have been overplotted (see Sect. 2.1 for details). The 24 μm image traces the hot dust at the border of the pillar facing the star λ Ori, where the ionization front from the O-type star is interacting with B30. Another bright region at 24 μm is found about 4 arcmin to the north of this sharp edge, where several point-like sources surrounded by extended emission are located.
Our LABOCA map at 870 μm, tracing mainly the emission of cold dust, reveals tens of cores, some of them showing extensions and substructure, which follow the filaments seen in the MIPS image at 24 μm, and which are mainly distributed in two parts of the cloud. The first group of cores lie slightly north of the edge of the HII region, and are arranged in filaments elongated in the east–west direction, while the second group matches well the 24 μm bright emission 4′ north of the cloud border and follow a rather north–south direction.
We identified a total of 34 cores above the 4-σ level (see their labels in Fig. 1), and their flux and envelope mass (see below) are provided in Table 2. Near the edge of the HII region, sources B30-LB21 to B30-LB24, and B30-LB29 to B30-LB31 follow remarkably well the 24 μm emission tracing the border of the pillar. In this region the two strongest sources are B30-LB19, which is associated with a 24 μm point source, and B30-LB27, which is more extended and fainter in the infrared. A ridge of faint sources (B30-LB20, B30-LB25, B30-LB26) joins B30-LB19 and B30-LB27. The other group of submm sources located farther to the north are also forming filamentary structures. For example, sources B30-LB05 to B30-LB07 are arranged in one single north–south filament, and sources B30-LB08, B30-LB09 and B30-LB12, are forming a chain of cores along the southeast–northwest direction. Finally, sources B30-LB02 to B30-LB04, still 4′ farther to the north, seem to be the continuation of the B30-LB05/B30-LB07 filament. The chain of cores B30-LB02/B30-LB07 is dark in the infrared, and is associated with only very weak 24 μm emission, contrary to the filamentary structure of cores B30-LB08/B30-LB12, which is associated with bright 24 μm emission.
We estimated the envelope masses in the following way. The total mass M of gas and dust from thermal continuum emission, assuming that the emission is optically thin, is:
 (1)
(1)
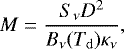
where Sν is the flux density at the frequency ν, D is the distance to the Sun, Bν (Td) is the Planck function at the dust temperature Td, and κν is the absorption coefficient per unit of total (gas + dust) mass density. Writing Eq. (1) in practical units:
![Mathematical equation: \begin{equation*} \left[\frac{M}{M_{\odot}}\right]=3.25\times \frac{\hbox{e}^{0.048\,\nu/T_{\mathrm{d}}}-1}{\nu^3 \kappa_{\nu}}\times \left[\frac{S_{\nu}}{\mathrm{Jy}}\right] \left[\frac{D}{\mathrm{pc}}\right]^{2}, \end{equation*}](/articles/aa/full_html/2018/04/aa27938-15/aa27938-15-eq2.png) (2)
(2)
where Td is in K, ν is in GHz and κν is in cm2 g−1. For the absorption coefficient at 870 μm or 345 GHz we used the interpolated value from the tables of Ossenkopf & Henning (1994), for the case of thin ice mantles and density of 106 cm−3: 0.0175 cm2 g−1. Since we do not know the evolutionary status of the detected cores, we have adopted an average dust temperature of 15 K for both pre-stellar and protostellar cores (see e.g., Sánchez-Monge et al. 2013).
The total masses estimated from the 870 μm continuum emission range from 0.043 up to 0.166 M⊙ (or 0.279 M⊙ if the extended emission is taken into account). The sources with largest masses, above 0.1 M⊙, are B30-LB01, B30-LB19, B30-LB27, B30-LB30 and B30-LB32, if we only consider the peak. In addition, when the extended emission is taken into account, this limit is also surpassed by B30-LB06, B30-LB08, B30-LB13, B30-LB21 and B30-LB25. Thus, the submm sources with dust masses below 0.1 M⊙ are: B30-LB02, B30-LB03, B30-LB04, B30-LB05, B30-LB07, B30-LB09, B30-LB10, B30-LB11, B30-LB12, B30-LB14, B30-LB15, B30-LB16, B30-LB17, B30-LB18, B30-LB20, B30-LB22, B30-LB23, B30-LB24, B30-LB26, B30-LB28, B30-LB29, B30-LB31, B30-LB33 and B30-LB34.
3.2 Evolutionary status of the optical/IR counterparts to the submm sources
After the compilation of our photometric catalog of possible counterparts of the APEX/LABOCA sources (Table 2), our firststep has been to identify possible infrared excesses based on Spitzer/IRAC data. Figure 3 displays a CCD – panel a – and several color-magnitude diagrams (CMD) – panels b–e – for the counterparts identified within the 34 APEX/LABOCA sources. The figure also includes data corresponding to the somewhat older C69 cluster, which also belongs to the same star forming region (5 Myr for C69 versus 1–3 Myr for B30). The data come from Barrado y Navascués et al. (2007), Barrado et al. (2011) and Bayo et al. (2011). We have also added information (plotted in the figure) regarding members in Taurus (Luhman et al. 2006) and Serpens (Harvey et al. 2007), which is about 1–2 Myr. We have included several extra-galactic samples from Sacchi et al. (2009): we show theAGN1/QSO1/broad lines and AGN2/obscured QSO/narrow lines as well as resolved galaxies and emission line galaxies (which include AGN and star forming galaxies), respectively. We have been able to establish whether ourB30 counterparts are likely members or not (see below), and our classifications are indicated in the figure.
Figure 3 clearly shows that a significant number of our counterparts might have circum-(sub)stellar disk or envelopes. Therefore, some might be classified as Class II or Class I objects, or something in-between. There are a number of disk-less objects (Class III), and some of them might even belong to the association, in an analogous situation to what happens in Taurus (simultaneous presence of members in the Class I, II and III phases, see panel a). However, it is also clear, from the comparison with resolved and emission line galaxies and AGN from Sacchi et al. (2009), that our sample can be polluted by a significant number of extra-galactic sources, specially for the faint end (Spitzer/IRAC I1 ≥ 15 mag). Therefore, in order to select bona-fide candidate members, we have carried out a detailed comparison using our wealth of data. These figures (see e.g., Fig. 4) suggest that the pollution by extra-galactic sources should be reduced, since the loci of most of our candidates in the CMDs are not coincident with the population of galaxies. In fact, confirmed members in Serpens from Harvey et al. (2007) are closer to these pollutants. Moreover, the number of extra-galactic sources (Surace et al. 2004; Sacchi et al. 2009) within the APEX/LABOCA beam should be around 1–2.5 galaxies, and 0.07–0.03 within the central 5 arcsec (i.e., an improbable chance alignment between an extra-galactic center and the submm source).
Both Harvey et al. (2006) and Gutermuth et al. (2008) discuss the nature of Spitzer sources based on CCDs and CMDs built with IRAC and MIPS data, namely [(I2–I3),(I3–I4)], [(I1–I3),(I2–I4)], [I2,(I2–I4)]. We have used their criteria and verified that a small number of our possible counterparts fall in the regions where extra-galactic sources are located. We note that young substellar objects could be located in the same areas in the CCD and CMD (see the case of an excellent proto-BD in Taurus Barrado et al. 2009; Palau et al. 2012). We have classified these objects as possible extra-galactic, and added the tag G to the membership criteria listed in Table 7.
Moreover, for the handful also having optical photometry in the I band, we have checked their position in an optical/near-IR/mid-IR CCD, following Bouy et al. (2009), in order to reveal the presence of quasars. Only two of them appear likely to be quasars, and this information has been added to Table 7. Obviously, additional analysis is required to assess the membership of all these counterparts to the B30 association.
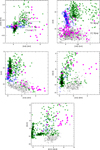 |
Fig. 3 Spitzer/IRAC CCD and CMDs. The first panel (top, left) displays the areas where Class I, II and III objects are located (assuming a stellar or substellar nature). The optical/IR counterparts of the B30 APEX/LABOCA sources are represented as magenta circles (solid for probable and possible members, empty circles for unknown status and a black cross for probable and possible non-members). For comparison, we have added known members of the ~5–8 Myr cluster C69 as plus, blue symbols, which is located in the same star forming region complex (Dolan & Mathieu 1999; Barrado y Navascués et al. 2004, 2007; Morales-Calderón 2008; Barrado et al. 2011; Bayo et al. 2011). We have also added confirmed members of Serpens from Harvey et al. (2007), about ~2 Myr, as green-black asterisks. Most of our B30 counterparts can be classified as Class I or as transitional objects between Class I andClass II. Other panels include extragalactic sources as light gray symbols and have been extracted from Sacchi et al. (2009): up- and down-ward open triangles correspond to the AGN1 and AGN2, whereas three-point stars represent emission line galaxies and open circles other galaxies. We also have include BT-settl isochrones (Allard et al. 2012)with 3 and 20 Myr. |
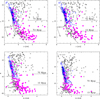 |
Fig. 4 Color-magnitude diagrams for the B30 APEX/LABOCA counterparts. Symbols as in Fig. 3, but in these panels we have included confirmed members of Taurus from Luhman et al. (2006), about 1–2 Myr, as asterisks. As a reference, the locations for 72 and 13 MJup very low-mass objects at 3 Myr are also included, based on 3 Myr isochrone by (Allard et al. 2012). |
3.3 Membership of the optical/IR counterparts to the submm sources
Several additional CMDs, which combine near- and mid-IR photometry, can be found in Fig. 4. This figure is similar to Fig. 3, but in it we have included several BT-Settl isochrones from the Lyon group (Allard et al. 2012) namely those corresponding to ages of 3 and 20 Myr, in order to establish whether the counterparts are young or old. Without taking into account the interstellar and inter association reddening (as well as that produced by the object itself), these diagrams suggest the presence of a very large number of very low-mass objects. However, as stated before, we expect a significant rate of pollutants and the reddening effect should be taken into account (it will be dealt with later on).
For each object and CMD, when the photometry is available, we have assigned a qualitative membership tag, namely Y – younger than 20 Myr, Y? – between 20 and 50 Myr, N? – between 50 and 10 000 Myr and N – older than the 10 000 Myr isochrone. These last two isochrones are not represented in the figure for clarity. We note that the interstellar reddening vector is practically parallel to the isochrones (indicated each panel), so it has not relevant effect in this classification.
Moreover, in order to consider all the photometric information simultaneously, we have derived the effective temperatureand bolometric luminosities of all possible counterparts by using VOSA (Bayo et al. 2008). Since the current version of VOSA includes the possibility of adjusting the reddening, we have produced two sets of Teff and LBol: i) by fixing Av = 0.322 mag – an average value for the Lambda Orionis star forming region – and ii) by letting it be variable. We always assumed a distance of 400 pc, solar metallicity ([Fe/H] = 0.00) and log g = 3.5 dex. Results are listed in Table 7. We selected BT-Settl models from Allard et al. (2012) and two Hertzsprung–Russell Diagrams are represented in Fig. 5. A similar exercise to the one carried out with the CMD, regarding membership and qualitative tags, has been executed using the effective temperature and the bolometric luminosity. However, in this case objects located between the 20 and the 10 000 Myr isochrones have been labeled as Y?, whereas objects looking like older than the Universe (below the 10 000 Myr isochrone) has been assigned the tag N, since they are either extra-galactic or the assumed distance is incorrect (and they cannot be related to the B30 cloud).
All these membership quality tags, when combined with the information regarding the number of photometric points in the SED, the SED shape and the evolutionary status (Class I, II and III, based on the IRAC data), and the possibility of being extra-galactic sources, have been used to produce a final membership classification (Table 7). In the end, we have been able to provide a final membership classification: probable and possible members (tags Y and Y?) and possible and probable non-members (N? and N). They are represented in Figs. 3 and 4, whereas Fig. 5 differentiates probable and possible members with solid and open green circles. We note that for some counterparts, we have not been able to elucidate whether they belong or not to the association due to the lack of enough photometric information. These objects are listed with a “–” tag.
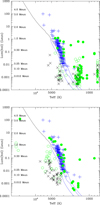 |
Fig. 5 Rejection of possible counterparts based on their location on the HRD. Big, black crosses correspond to possible and probable non-members. Candidate members are shown as open green circles (possible members) and solid green circles (probable members). The bolometric luminosity and the effective temperature were derived using a fixed value of the reddening (Av = 0.322) or it was derived during the fitting process (top- and bottom panels, respectively). Collinder 69 known members, located at similar distance, are displayed as blue plus symbols, and were selected from Dolan & Mathieu (1999), Barrado y Navascués et al. (2007), Morales-Calderón (2008) and Barrado et al. (2011). Isochrones correspond to a 20 Myr isochrone from Siess et al. (2000) – upper part of the main sequence, in black – and Settl models – blue lines with 1, 20 and 10 000 Myr – from the Lyon group (Allard et al. 2012). We note that some possible members can be found well below the Collinder 69 cluster sequence. |
3.4 Bolometric luminosity and temperature
By using our massive multi-wavelength database, which includes photometry from 0.5 to 870 μm, we have estimated the bolometric temperature and luminosity (see details in Palau et al. 2012). The results are listed in Table 8 and displayed in Figs. 6 and 7, where we have included several samples of young stars and VeLLOs (Chen et al. 1995; Young & Evans 2005; Dunham et al. 2008; Bayo et al. 2011; Tobin et al. 2016). Our Barnard 30 targets appear as green, cyan and red symbols (depending on the figure and the classification, see Sect. 2.7), where the size increases with the number of data-points (i.e., being more reliable those with a bigger size). We have only included those objects detected at 24 and/or 70 μm. They display significant IR excesses, so the Tbol and Lbol departs from our previous estimate of Teff and Lbol based on VOSA (the photospheric emission). Our B30 objects have been classified, in most cases, as Class I or Class I/II based on the IRAC data. We note that the fluxat 870 μm has been assigned in general to the “a” components when there are multiple identifications (see Appendix A). Thus, we have studied in detail 15 objects detected at 24 μm which are within 11 APEX/LABOCA sources and another eight objects in four different LABOCA beams which display an emission at 70 μm but they do not have a detected counterpart at 24 μm.
Figures 6 and 7 strongly suggest that we have uncovered a few examples of very young, low-massive objects. They would be objects in the evolutionary stage between Class 0 and Class I in the classification scheme of Lada (1987) and Adams et al. (1987). If we take into account the Lint, as estimated from the flux at 70 μm, one object seems to follow fully in the VeLLO category (LB19d, Huélamo et al. 2017). In addition, there is a sample of Class I objects with bolometric luminosities below 0.1 L⊙ and Lbol in the range 70–700 K. Unfortunately, some of them have less than ten data-points in the SED and therefore they are not very well characterized. In any case, since there is also another subsample located in the Class II or III area, as defined by Young & Evans (2005) and Dunham et al. (2008), it seems that there is an evolutionary sequence from Class 0/I very low-mass objects, probably substellar, down to the pre-main sequence. This trend persists even if the fluxes at 870 μm (and 70 μm when available) are included for these counterparts. As a matter of fact, although the Lbol increases, Tbol is shifted toward cooler values and new candidate VeLLOs appear (if, indeed, they are the origin of the submm emission). Regardless of this assumption, what we might be contemplating in the Barnard 30 dark cloud is the unveiling of the brown dwarf population. In next subsection we explore this possibility by having a look at the individual objects. In any case, the 20 objects clearly detected at 24 and/or 70 μm have been classified as: two WTTs, four CTTs, five YSOs, eight proto-BD candidates and one VeLLO. Another three objects have emission at 24 μm strongly affected by the extended photometry, although they seem to be substellar and they can be classified as proto-BDs candidates.
3.5 Starless cores? LABOCA sources without unambiguous young optical/IR counterparts
In the case of six LABOCA sources, namely B30-LB01, B30-LB06, B30-LB13, B30-LB15, B30-LB16 and B30-LB34, there is not any optical/IR counterpart detected within 5 arcsec. Some include several counterparts detected between 5 and 27 arcsec which have been classified as probable or possible cluster members, but they do not display any obvious excess. In these six cases, we have considered the possibility that these submm sources are starless cores in B30, and we have investigated their nature. We note that all of them lack data at 70 μm, either because there is no positive detection or because the LABOCA source is outside the MIPS M2 FOV.
B30-LB15 and B30-LB16 have envelope masses around 0.05 M⊙. The marginal detection of these sources prevents us from drawing any further conclusions regarding their nature. Each of them contains only one candidate member (counterparts #a in both cases, see Fig. A.8) and their SED (Fig. A.9) are typical of a Class III, disk-less object, although in the case of B30-LB16a it seems substellar. Thus, no convincing optical/IR counterpart can be assigned to these cores.
B30-LB34 has been only detected with APEX/LABOCA. It can be considered as a starless core. We note, however, that it is associated to B30-LB33 (Fig. A.8), a Class II star. Thus, if physically associated, they would conform a pair in very different evolutionary stages.
B30-LB01, B30-LB06 and B30-LB13 have relatively large submm flux densities, and thus their estimated envelope masses are among the largest, between 0.108 and 0.260 M⊙ (or 0.077 and 0.166 M⊙ if we only take the peak intensity for the extended sources). Given that these masses are around the substellar regime (~0.072 M⊙), and the known fact that not the entire mass of a starless core ends up to form the star, these are excellent candidates to pre-substellar (pre-BD) cores, that is, cores which will form BDs in a future but did not form an hydrostatic core yet (e.g., Palau et al. 2012; André et al. 2012). Their submm emission is also extended in these three cases, with sizes of 22, 49 and 23 arcsec, respectively. In order to elucidate their true pre-BD nature, it is necessary to conduct observations of molecular lines, to assess whether these cores are indeed gravitationally bound. If confirmed, they would provide strong evidence favoringthe formation of brown-dwarfs in isolation, and thus their formation from the gravoturbulent-fragmentation scenario.
Temperatures and luminosities for Barnard 30 objects with significant infrared excesses.
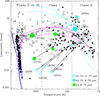 |
Fig. 6 Lbol versus Tbol after Young & Evans (2005) and Dunham et al. (2008). Sources compiled in these two works, with evidences for being embedded low luminosity sources, are shown as solid black squares. Young members from Tobin et al. (2016) in Perseus are displayed as open squares. The black crosses correspond to Taurus members in Chen et al. (1995), whereas solid, black circles comefrom Bayo et al. (2011) and the Collinder 69 cluster. The cyan, short-dashed lines show the evolutionary tracks for the three models with different masses (in solar masses) considered by Young & Evans (2005). The magenta, dotted and long-dashed lines show the evolutionary tracks for three models considered by Myers et al. (1998). The blue solid lines correspond to isochrones by Baraffe et al. (1998). The vertical dashed lines show the Class 0–I and Class I–II Tbol boundaries from Chen et al. (1995). The big, labeled circles correspond to several counterparts for our B30 sources detected at 70 μm (our group A). Green with detections at 24 μm and cyan undetected at that band. Solid (green or cyan) circles denote counterparts whose properties have been derived with the 870 μm flux (for counterparts assumed to the primary origin of the submm emission), whereas open symbols represent values estimated without this flux, and the arrows move their location to the values derived when including this value. |
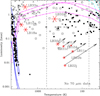 |
Fig. 7 Symbols as in Fig. 6 except for our B30 sources. Sample in group C1 are located outside the area surveyed by MIPS M2 but they have been detected at 24 μm. The red asterisks represent values estimated when the flux at 870 μm has not been included, whereas the end of the arrows signals the values derived with the submm flux. |
4 General discussion and conclusions
The analysis of the LABOCA data of B30 has revealed the detection of 34 submm sources. Fifteen of them have a clear optical/IR counterpart within 5 arcsec (Table 2), have been classified as a probable or possible cluster members and they display a significant infrared excess. Among them, six have been detected at 24 μm with MIPS M1. Another two do not have emission at this band but have been detected at 70 μm with MIPS M2. Therefore, we can conclude that the excesses are well established and the sources are well characterized. Nine out of the 15 might be substellar objects based on the mass of their envelopes and the shape of their SED. Another one would be at the borderline between stars and BDs. In any case, the final mass would depend on the actual reddening due both to the dark cloud and the object itself (when the submm emission is extended).
Two submm sources in this group are visual binaries, in the sense that there are two optical/IR counterparts which have been classified as probable/possible members, display infrared excesses and are located within the central 5 arcsec of the LABOCA beam. Our current spatial resolution does not allow to assign it to any component. One system, namely B30-LB19, has a primary component (counterpart #a) at the borderline between stars and BDs, while the more massive component, further away from the center of the submm emission, would be stellar. Even further, but still inside the 27.56 arcsec of the APEX/LABOCA beam, there are several possible/probable members, classified as Class I sources, which could have a substellar nature. Therefore, we may be dealing with a clump which is giving birth to several very low-mass stars and/or BDs. The other APEX/LABOCA binary, namely B30-LB25, includes counterparts #a and #e.
The second group is composed by those submm sources (13) with no optical/IR counterpart within 5 arcsec but which include sources within the APEX/LABOCA beam displaying excesses (labeled excess in Table 2). All 13 sources contain within the submm beam at least one optical/IR counterpart which can be classified as BD if membership is confirmed. Eight out of 13 have envelope masses below the substellar limit and, in fact, the individual SEDs are characteristic of BDs, if members. In any case, due to the number of possible and probable members identified within the submm beam, we cannot unambiguously assign the source of the submmillimeter emission to any individual object. Nine have been detected at 24 μm (although three of these detections are problematic due to the extended nebulosity and it is possible that some among these three are not real).
Finally, six LABOCA sources might be starless cores, with three of them having masses near the substellar limit and thus are pre-BD corecandidates. An additional follow-up of molecular line observations is required to confirm their dynamical status and their nature.
Regarding multiplicity, it seems there is no obvious difference between the submm sources with a counterpart closer than 5 arcsec and without it. The first one contains multiple possible and/or probable members as counterparts within the APEX/LABOCA beam in 13 cases out of the 15 sources. The ratio is 11–13 for the second group. However, the six starless cores might be genuinely different, since the ratio is three out of six. However, the low number statistics might be playing a role.
Based on the availability of data at 70 and 24 μm, we have discussed the properties and evolutionary stage of our submm sources in Barnard 30. Overall, the most relevant object is B30-LB19d. With Lint = 0.094 L⊙, as estimated from the flux at 70 μm, it is the best Class I BD identified so far in this star forming region. Huélamo et al. (2017) has suggested that it could be associated with a bipolar nebula. Six counterparts, namely B30-LB11a, B30-LB12d, B30-LB22b, B30-LB22j, B30-LB30g and B30-LB31c, have been detected at 24 μm and they have been classified as proto-BD candidates. In addition, three objects associated to B30-LB29 (#a, #b and #f) and the two counterparts related to B30-LB23 (counterparts #a and #c) are very interesting proto-BD candidates, since these two LABOCA sources have been detected at 70 μm. However, the problematic photometry at 24 μm or lack of it poses some significant caveats regarding their evolutionary status. Finally, we have identified four sources at 24 μm which are located outside the MIPS M2 FoV (LB12a, LB18a, LB32a and LB33a), so there is no information regarding the emission at 70 μm. They seem to be of stellar nature. B30-LB14, which includes the counterparts #a and #b, and has been detected at 70 μm, seems to be of stellar nature. We note that Liu et al. (2016) have found a Class 0 protostar and a proto-BD candidate west of our study. Our pre- and proto-BD candidates seem to be fainter and/or cooler than this candidate, called G192S, based on the comparison between the SEDs (see their Fig. 26).
We can compare our results in B30 with those from two regions with very different properties: Chamaeleon II (Cha II, see de Gregorio-Monsalvo et al. 2016) and the B213-L1495 clouds in Taurus (B213 hereafter, Palau et al. 2012; Morata et al. 2015). Unlike B30, these are low-mass star forming regions that lack massive stars, and therefore do not suffer from the strong and ionizing winds associated to hot, massive objects.
In the case of Cha II we followed a similar strategy as in B30, and surveyed a region of ~ 34′ × 34′ with APEX/LABOCA, detecting a total of 15 submm sources (the rms was 4 mJy). Two of them were classified as Class I stellar objects, one appeared to be a proto-BD candidate, and 12 were assigned the status of starless cores. Five (out of the 12) were good pre-BD candidates although kinematic information is needed to assess if they are, indeed, gravitationally bound.
In the case of B213, we have performed a more exhaustive study. We first isolated a sample of 12 proto-BDs based on Spitzer and near-IR data (Barrado et al. 2009). We studied these candidates with different submm, mm and cm continuum observations, together with several gas molecules like CO, 13 CO and N2 H+ data (for details see Palau et al. 2012). As a result, we have confirmed two very good proto-BD candidates and one pre-substellar core candidate. All the sources from these two works focusing on B213 were also observed with the JVLA, and we reported the presence of thermal radiojets in four of them (Morata et al. 2015).
We have also performed a similar detailed study to unveil the nature of all the selected candidates in B30 (Huélamo et al. 2017). One important goal is to understand if the overall properties of the region (e.g.,fraction of proto-BD and pre-BD cores) are different due to the presence of the hot star λ Ori when compared with other regions with a different environment.
As a final, general conclusion, the complete characterization of our APEX/LABOCA sources, focusing on those detected at 24 and/or 70 μm, indicates that in our sample of 34 submm sources there are, at least: two WTTs, four CTTs, five YSOs, eightproto-BD candidates (with another three dubious cases due to the extended emission at 24 μm) and one VeLLO. In addition, we have identified a substantial number of proto-BD and substellar starless cores in the young Barnard 30 dark cloud, located at about 400 pc. They are prime targets for further follow-up and characterization, as we have done in Taurus. In general, high spatial resolution observations (with e.g., ALMA, Huélamo et al. 2017, and other submm and mm arrays), both in the continuum and in specific lines, are necessary to assign the correct counterpart to the submm sources, to confirm these proto-BD and pre-BD core candidates and to reveal their characteristics and formation mechanism.
Acknowledgements
We thank the Calar Alto Observatory staff for their excellent work taking the near-IR data under the Service Mode program. A special thanks to Rosario Lorente Balanza for her help with the Akari data. We do appreciate the big role the anonymous referee has played in this paper. Although we did not always agree, we thank her/him for the significant contribution. We also thank Almudena Alonso-Herrero for her help with the MIPS photometry. This research has been funded by the Spanish grants AYA 2014-55840-P, and AYA2014-57369-C3-3-P, ESP2015-65712-C5-1-R, and ESP2017-87676-C5-1-R. AP and MTR acknowledge financial support from UNAM-DGAPA-PAPIIT IA102815 grant, México, and from CATA (PB06) CONICYT, Chile, respectively. AB was financed by proyecto Fondecyt Iniciación 11140572 and the Millennium Science Initiative (Chilean Ministry of Economy), through Núcleo Milenio de Formación Planetaria. It makes use of VOSA, developed under the Spanish Virtual Observatory project supported from the Spanish MICINN through grant AyA2008-02156, and of the SIMBAD database, operated at CDS, Strasbourg, France. This publication makes use of data products from the Wide-field Infrared Survey Explorer, which is a joint project of the University of California, Los Angeles, and the Jet Propulsion Laboratory/California Institute of Technology, funded by the National Aeronautics and Space Administration. The paper was finished during a stay at ALMA and ESO headquarters in Santiago de Chile by DB and NH, which were supported by ALMA & ESO and by the BBVA foundation, respectively, and another at Universidad de Valparaiso by DB, supported by proyect Proyecto Fondecyt de Iniciación 11140572 (Chile).
Appendix A: Classification of the LABOCA submm sources and the counterparts
A.1: Group A: LABOCA sources detected at 70 μm
Maps obtained with Spitzer/MIPS M2 might cover only half of the surveyed area due to the loss of one detector. This is our case and we do not have measured fluxes at 70 μm for 20 APEX/LABOCA sources. Of the other 14, only six have been detected at this wavelength and they are discussed in this section. The size of the MIPS M2 beam is about 18.6 arcsec (Frayer et al. 2009), about half of the value of APEX/LABOCA, whereas the MIPS M1 beam is much smaller, 5.8 arcsec. Thus, a visual inspection has been carried out in order to confirm our identifications (Figs. A.1 and A.3). We note that APEX/LABOCA has a nominal pointing error below ~2 arcsec. As stated before, the actual rms of the pointing is about 1 arcsec. Although these optical/IR sources are the most probable counterparts to the submm detections, there are additional young sources within the LABOCA beam that might contribute to (or less probably be responsible for) the measured flux. Thus, we discuss here all sources within the LABOCA beam which have been detected and present mid-IR emission.
A.1.1: Group A1: LABOCA sources detected at 24 μm
B30-LB14. B30-LB14a is a Class II object (based on the IRAC data displayed in Fig. 3, and in the SED, shown in Fig. A.2), as classified based on IRAC photometry, located within the central 5 arcsec of the LABOCA beam. It is one of the brightest objects in our sample, fully within the stellar domain. The SED has been represented in Fig. A.2. For comparison, we have overplotted in the SED panel the expected emission of a 3 Myr object with 0.072 M⊙ without interstellar absorption and with a value of AV = 10 magnitudes (black solid lines). We note, however, that the interstellar extinction as estimated with the Av map from 2MASS data is 2.471 mag (Sect. 2.5.6). The SED allows us to derive bolometric temperature and luminosity of 1284 K and 0.998 L⊙. The internal luminosity, as derived from the MIPS M2 flux, is 0.276 L⊙. This source has been detected with ALMA, see details in Huélamo et al. (2017) and it can be classified as a CTT. The envelope mass can be estimated as 0.051 M⊙, based on the flux at 870 μm.
South of the central counterpart is located B30-LB14b (Fig. A.1), also detected at 24 μm (both objects have been detected with WISE W3 and W4 filters at 12 and 22 μm). The bolometric temperature and luminosity of #b, taking into account the fluxes up to 24 μm (i.e., including MIPS M1), are 1093 K and 0.046 L⊙ (i.e., within the substellar domain, in full agreement with the SED analysis with VOSA). Thus, the evolutionary status would correspond to a Class II BD. However, due to the uncertainty in the assignment of the 70 and 870 fluxes, we have repeated the calculation assuming that these fluxes correspond to source #b. Thus, we have derived  K and
K and  L⊙. Figure 6 displays Lbol versus Tbol. The arrow links both sets of values for B30-LB14b and suggests this counterpart might be a Class I object at the border between stars and BDs (a very low-mass YSO or massive substellar analog).
Other interesting objects within the B30-LB14 beam are #d and #h. Both are very faint and have been detected only at J, H, I1 and I2 and with increasing fluxes. The data for #f and #i are even more scarce. All four are worth further follow-up, since they might be in the substellar domain.
B30-LB19. B30-LB19 can be identified with the source IRAS 05286+1203 (RA = 82.8671, Dec = +12.0899). This object was included in the work by Connelley et al. (2008), which focused on Class I stellar sources. However, due to the lack of spatial resolution and the large number of objects, we have not included the IRAS data (indicated in Fig. A.2) in any calculation. In any case, the APEX/LABOCA source is also extended with a size of 24 arcsec. The central source, B30-LB19a, is within the 5 arcsec peak and it is a probable member. It can also be classified as a very low-mass, Class I member based on the IRAC data and the near-IR photometry (see also Fig. 6). It does not have an optical counterpart and it is at the border line between BDs and stars. We estimate the mass of the envelope as 0.116 or 0.182 M⊙, depending whether we take the peak intensity or all the submm emission – the total flux density, respectively. The bolometric luminosity is 1.218 L⊙ with Tbol = 238 K, whereas the internal luminosity can be estimated as 0.402 L⊙ from the flux at 70 μm. This source has been detected with ALMA and by APEX/SABOCA, see details in Huélamo et al. (2017). It can be classified as a YSO. B30-LB19b is also within 5 arcsec of the nominal center of the LABOCA emission. Its photometric data indicate it is a very low-mass stellar object with IR excess.
The MIPS M2 image also contains another source which nicely overlaps in near and mid-IR with B30-LB19d. The SED of this object is consistent with a Class I object with Tbol = 281 K and Lbol = 0.172 L⊙, in agreement with the IRAC data. Adding the 870 μm flux (i.e., estimating an upper limit for the luminosity) would modify these values by about a 10%. We note however that the near-IR images reveal/suggest a high-inclined system with a bipolar nebula (Huélamo et al. 2017). The Lint, as derived by the 70 μm flux, is 0.094 L⊙. Thus, it seems we are dealing with a bona fide VeLLO in what seems to be a wide multiple system.
Other interesting objects, based on their membership and SED, are #e and #f. Both have been classified as Class I and I/II based on the IRAC data and seem to be substellar. This fact reinforces the idea that we are dealing here with a probable young, multiple system with very low individual masses.
A.1.2: Group A2: LABOCA sources undetected at 24 μm
B30-LB08. This source is extended, with an estimated size of 27 arcsec, with elongated contours (Fig. A.3). It has been detected by ALMA (Huélamo et al. 2017). The SED corresponding to #a, as displayed in Fig. A.4, is quite remarkable. A possible member of the association, this object is barely within the central 5 arcsec and seems to be, in principle, substellar, it has no excess in IRAC or MIPS/M1 (undetected) and has a very strong excess in the far-IR, as measured with Akari/FIS and MIPS/M2. However, there is an offset with the near-IR source (the M2 center is closer to the #g counterpart), although in part it might be due to the beam size and the positional uncertainty. The alternative is that this contribution comes from another source. The envelope mass is 0.106 M⊙ or 0.066 M⊙ (total submm flux or the peak intensity, respectively). Based on these data, it would be a substellar transitional object between embedded and Classical T Tauri stages (a YSO). However, the integrated bolometric luminosity for #a, as derived from the SED and taking into account the far-IR fluxes, is 12.007 L⊙, and Tbol reaches 50 K, although these values should be used with caution, based on the above discussion. The internal luminosity, following the prescription by Dunham et al. (2008) and using the emission at 70 μm, is much smaller, Lint = 1.223 L⊙, but still much higher than typical values for VeLLOs. Other counterparts have been classified as non-members and have not been plotted on the figure.
B30-LB23. The dust mass from the submm emission can be estimated as 0.046 M⊙ whereas the internal luminosity is 0.189 L⊙. There is no optical or near-IR counterpart within 5 arcsec of the nominal center of the APEX/LABOCA beam. The closest is B30-LB23a and neither it or any other possible counterpart have a detected emission at 24 μm with MIPS. However, another two sources, namely #b and #c, have been detected with WISE W4. In any event, the M2 detection is located between #a and #c and we have computed their bolometric luminosity and temperature with and without including the fluxes at 70 and 870 μm, yielding Tbol = 312 K and Lbol = 0.008 L⊙, or  K and
K and  L⊙ for #a; Tbol = 290 K and Lbol = 0.008 L⊙, or
  K and
K and 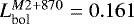 L⊙ for #c. With these properties, they would be YSOs of possible substellar nature (proto-BDs).
In addition, counterpart #b is characterized by 697 K and 0.006 L⊙, assuming that the W4 measurement is real. These values are represented in Fig. 6. As in the other counterparts, we may be dealing with a proto-BD, in any case a YSO.
Other interesting counterparts, red and faint but not detected at mid-IR, are #g and #h. We note that the MIPS M1 image taken in 2005 has an artifact centered on counterpart #f, as can be easily detected by comparison with the image obtained at the beginning ofthe mission one year earlier.
B30-LB25. B30-LB25 is extended (34 arcsec) with a total mass of the envelope of 0.0126 M⊙ (0.076 M⊙ for the peak emission). It is close to B30-LB20 and B30-LB26 (Fig. 1). To avoid ambiguity, the common sources have been assigned to B30-LB25. Another nearby submm source is B30-LB24. The maximum emission is at Spitzer/MIPS at 24 μm, but is diffused, and happens to be in between both APEX/LABOCA sources.
We have assigned the M2 flux to the component B30-LB25c, which is located close to a source detected with the Akari satellite with FIS (Fig. A.3). The integrated fluxes for #c, including the 70 μm value, produce Tbol = 69 K and Lbol = 1.709 L⊙. Adding the flux at 870 μm modifies these values resulting into 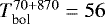 K and
K and 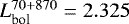 L⊙. The internal luminosity is 0.557 L⊙. In any event, B30-LB25c would be a YSO or Class 0 proto-star (Class I/II from the IRAC CCD, Fig. 6).
At the center of the B30-LB25 submm emission is #a, likely substellar. Moreover, the counterpart #e is within the central 5 arcsec, fainter than #a and seems to be also a Class I object. Thus, it is quite possible we have identified a visual very young BD binary with an angular separation of 5.5 arcsec which might be (or not) bounded to a more massive component. Although it might be a projection effect, in principle the likelihood is very small and more probable they are coming from the same clump.
In addition, #b resembles a massive BD with an excess at 8 μm. The counterpart #f is interesting, but there are not enough data to characterize it properly, except that the IRAC data indicate it is a Class I/II object.
B30-LB29. Counterpart #a is a possible member and has an extended emission with MIPS at 24 μm. It also has been detected at 70 μm. It is within the central 5 arcsec of the submm peak. We note, however, that we might be dealing with a multiple system or at least with several unevolved BDs which have been born inside the same clump. Its bolometric temperature is 70 K, at the border between Class 0 and Class I (Chen et al. 1995), and the integrated luminosity reaches 0.271 L⊙, whereas the internal luminosity, as derived from Dunham et al. (2008), is Lint = 0.337 L⊙. This value is larger than Lbol derived from the integration along the SED. This fact might be due to the way Lint has been estimated. First, Lint is affected by a factor of two in the uncertainty (as derived by the spread in their Fig. 4). On the other hand, our fluxes in B30 are below the lower limit in the case of the Taurus members used by Dunham et al. (2008) and this extrapolation might have a consequence on the derived Lint. In any case, as in previous candidates, the mass from the envelope, 0.064 M⊙, is inside thesubstellar domain. Our tentative classification corresponds to a YSO, perhaps in the substellar domain (a massive proto-BD). On the other hand, B30-LB29 #b and #f have near-IR excesses and can be classified as YSOs. Their bolometric temperature and luminosity are 533 K and 0.016 L⊙ and 926 K and 0.010 L⊙, respectively. Counterpart #g, faint and detected only at J, I1 and I2, presents increasing fluxes at longer wavelengths. Another interesting object is #i, substellar if member. Again, we may be dealing with a multiple system or at least with several unevolved BDs, perhaps physically associated.
A.2: Group B:LABOCA sources undetected at 70 μm
A.2.1: Group B1: LABOCA sources with detection at 24 μm
B30-LB24. The MIPS M1 image (or the contours in the J image, Fig. A.5) indicates that there is an extended emission at 24 μm. Two sources are within it, B30-LB24 #c and #d. None of them is within the central 5 arcsec. The first one is characterized by Lbol ≤ 0.555 L⊙ and Tbol = 71 K, whereas the other has Lbol = 0.099 L⊙ and Tbol = 254 K (≤0.531 L⊙ and 88 K if the upper limit at 70 μm is included). Both look like Class I stellar members (YSOs). The mass of the envelope is 0.044 M⊙ with Lint ≤ 0.604 Lbol. Other relevant possible members within the LABOCA beam are #a, #e and #g, especially this last one, whose SED corresponds to a Class I or II object, possibly of substellar nature.
A.2.2: Group B2: LABOCA sources undetected at 24 μm
There are seven LABOCA sources without emission at 24 μm and detection limits at 70 μm, namely B30-LB01, B30-LB02, B30-LB09, B30-LB13, B30-LB15, B30-LB20 and B30-LB28. B30-LB01, B30-LB13 and B30-LB15 do not display any special behavior (apart of the substellar candidate B30-LB13b) and they will not be discussed in this subsection. However, in all these three cases the optical or near-IR counterparts are farther than 5 arcsec from the center of the LABOCA emission and this could indicate they are, in fact, starless cores (Sect. 3.5).
B30-LB02. The counterpart #a only has been detected with IRAC I1 and I2, being the flux at 4.5 μm stronger than at 3.6 μm, although close to the detection limits. It is outside the central 5 arcsec. The mass of the submm envelope can be estimated as 0.099 M⊙ and the internal luminosity as Lint < 0.230 Lbol. Thus, this source is an interesting candidate since, if member, it would be substellar. Counterpart #d has only been detected with IRAC and its colors correspond to a Class I object (Fig. 3), but the SED suggests it is a Class II BD, if membershipis confirmed.
B30-LB09. There are several probable and possible members within the B30-LB09 beam (Fig. A.6). All three seem to be substellar (Fig. A.7) and, in fact, #a is located within the submm peak and has not been detected with MIPS either at 24 μm or at 70 μm. The upper limit at 70 μm yields an internal luminosity of Lint ≤ 0.422 Lbol. Therefore, we have identified it as the origin of the LABOCA emission and it is another excellent BD candidate with a significant submm emission and an envelope mass of 0.043 M⊙ (Sect. 3.1). We note, however, that the near-IR slope in the SED is not rising. Apart from the central source, there are two probable members within the B30-LB09 beam, namely #c and #e (Fig. A.6). Both seem to be substellar.
B30-LB20. This LABOCA source has two interesting counterparts, identified as #a and #d. Both are far from the submm peak (Fig. A.6). Moreover, they have been detected with WISE W3 and W4, but only #d has a possible, extended flux with MIPS M1. Most likely, both are Class II stars. The total mass of the envelope is 0.048 M⊙ and the internal luminosity is Lint ≤ 0.592 L⊙.
In addition, there are another two interesting objects, namely #b and #g, which could be substellar. They only have three data-points in the SED, but the shape suggests they might be Class II or even Class I. We note that B30-LB20c is DM142, but it does no show any IR excess. Moreover, Huélamo et al. (2017) have detected a 350 μm source with APEX/SABOCA within the LABOCA beam, but it does not have any optical or IR counterpart.
B30-LB28. The envelope mass for this submm source is 0.071 M⊙. Although the WISE fluxes measured for components #b and #c are uncertain, both have dubious emission at 24 μm and their SED indicates they are Class I or even Class 0 (the shortest wavelength they display corresponds to WISE W1). Thus, they are potential proto-BD candidates but additional data are required. In any case, there is no optical or IR source within the central 5 arcsec and the LABOCA source is elongated in the north-east direction, toward the very intense submm source B30-LB27.
Counterpart #d has been classified as I/II from the IRAC CCD (Fig. 3) and the complete SED agrees with this classification. If member, it would be substellar. This is the case of #a, but contrary to #d, there is no IR excess. We note, however, that there is submm emission as seen by APEX/SABOCA at 350 μm (Huélamo et al. 2017), However, because of the shape of the SED (Fig. A.7), we believe that they are unrelated although we cannot discard completely that B30-LB28a has a submm excess.
A.3: Group C: LABOCA sources with no data at 70 μm
A.3.1: Group C1: LABOCA sources detected at 24 μm
B30-LB11. The counterpart #a, detected with MIPS M1, is quite distant from the peak of the submm emission (Fig. A.8). The integrated properties are Tbol = 145 K, Lbol = 0.028 Lbol and an envelope mass of 0.046 M⊙. Thus, is seems it could be a Class I object in the substellar domain (a proto-BD candidate).
Moreover, counterpart #c displays an interesting SED with a significant flux at 8 μm. If member, it would also be substellar. Other interesting sources are #b and #e, since there are also red and faint.
B30-LB12. From the flux at 870 μm we derive an envelope mass of 0.087 M⊙. Counterparts #a and #d have been detected at 24 μm. The first one is the probable origin of the submm emission, since it is almost within the central 5 arcsec, and has Lbol = 0.418 L⊙ and Tbol = 2108 K. The IRAC data indicate it is a Class III star and the SED shows that the excess is only at 24 μm (i.e., a WTT).
More interesting is #d, with Lbol = 0.058 L⊙ and Tbol = 174 K. If the 870 μm flux is considered, the values change to 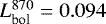 L⊙ and
  K, although it is at the edge of the submm beam. In any case, its properties make it a substellar Class I object (proto-BD candidate).
Other interesting possible or probable members are #c, #g and #j, specially the first one, very faint and classified as Class I based on the IRAC colors. In other words, another proto-BD candidate.
B30-LB18. Counterpart #a is not within the submm peak. It is a Class III star (possibly a WTT) with Lbol = 0.249 L⊙, Tbol = 1748 K and an excess only at 24 μm, being the mass for the dust envelope, as estimated with the flux at 870 μm, 0.059 M⊙.
The counterparts #b and #c might be of substellar nature. The first one, close to #a, presents increasing fluxes up to I2, suggesting it might be a Class I BD associated to #a (i.e., a proto-BD candidate in physical association to a more evolved low-mass star).
B30-LB22. Counterpart #a is located very close to the nominal center of the submm, it is a probable member and has a peculiar SED (although with only four points, Fig. A.9), indicating it is a Class I source of substellar nature, with an envelope mass of 0.088 M⊙. However, although #a is not detected at 24 μm, there is a SABOCA source at 350 μm (Huélamo et al. 2017). In addition, there is a source at this wavelength west of it, halfway toward component #b, which seems to the origin of it.
In the case of the counterpart B30-LB22b, Without taking into account the 870 μm flux, we derive Lbol = 0.016 L⊙ and Tbol = 255 K. When including the flux at 870 μm the estimates are  L⊙ and
  K. In either case, a Class I YSO of possible substellar nature. Counterpart #j is also detected at 24 μm and has 243 K and 0.008 L⊙, possibly a Class I BD (proto-BD candidate).
The LABOCA source includes another possible embedded object, namely #h. Finally, there are other two probable members: #c and #g. In addition, there is some overlap with B30-LB23 (Fig. 1), but there are no common optical or IR sources. B30-LB22f is also a submm source at 350 μm (Huélamo et al. 2017), but it does not seem to belong to the association and might be extra-galactic.
B30-LB30. The submm emission is extended and the derived mass for the envelop is 0.123 M⊙ (0.101 M⊙ at peak intensity). There is no counterpart within the submm peak, but nearby there are two objects detected either with MIPS M1 (#g) or W4 (#a). We have derived 0.059 L⊙ and 354 K for B30-LB30g without taking into account the 870 μm flux. With it, the bolometric luminosity and temperature for each of them would be  L⊙ and
  K. In any case, it seems we are dealing with very low-mass Class I objects (YSOs), perhaps the substellar nature. Counterpart #b lacks excess and might be substellar. Finally, #c has been classified, based on the IR data, as Class I/II BD (Fig. 3).
B30-LB31. This LABOCA source has also been detected by ALMA (Huélamo et al. 2017). The mass of the envelope is 0.082 M⊙. Counterpart#a is almost within the 5 arcsec beam of the submm source and presents a possible extended emission at 24 μm.
In addition, LB30-LB31c has been detected at 24 μm and its properties are Lbol = 0.048 L⊙ and Tbol = 264 K. Adding up the 870 μm would change these values to  L⊙ and
  K. Then, it is apossible Class I proto-BD candidate. Other relevant objects, because their faintness and red SEDs, are #h, #e and, especially because of the increased fluxes toward longer wavelength, #d.
B30-LB32. LB32a can be identified with the source IRAS 05293+1207 (RA = 83.0450, Dec = +12.1629). It was only detected at 60 μm and the flux, [60] = 1.15 ± 0.1725 Jy, agrees very well with the current SED (Fig. A.9) and the fluxes detected with Akari/FIS. It is outsidethe M2 FOV but it is detected with MIPS/M1. The integrated bolometric luminosity is 0.657 L⊙ with Tbol = 414 K, and the mass of the envelopeis 0.123 M⊙. In any event, we are dealing with a Class I stellar member of the association (a YSO), although the small dip observed at 4.5 μm might indicate it has already started to lose part of the envelope.
B30-LB33 and LB34. This double peak submm source is located at the Western border of our LABOCA map and outside the clustering of submm sources (or the dust structure seen with IRAC). The individual values for the masses of each envelope are 0.087 M⊙ and 0.064 M⊙, respectively. There is only one optical and near-IR counterpart located closer to B30-LB33 (counterpart #a, Fig. A.8), both identified previously by Dolan & Mathieu (1999, 2002) and by Duerr et al. (1982). It is GY Ori, identified by those works as DM115 and DIL19, respectively. There is no MIPS/M2 data but it has been detected at 24 μm. Thus, B30-LB33a has Tbol = 1920 K and Lbol = 2.079 L⊙. We have classified B30-LB33a as a Class II stellar member.
A.3.2: Group C2: LABOCA sources undetected at 24 μm
B30-LB03 and LB04. The sources B30-LB03 and B30-LB04 are very close to each other, as shown in Fig. A.10. While B30-LB04 does not show any counterpart within 5 arcsec, B30-LB03 shows one source, a YSO.
The SED of the central source of B30-LB03, #a for short, together with the previous analysis based on CC and CM diagrams, indicates it is a possible member with substellar nature, but without IR excesses up to 3.6 μm. Some excess might be at 4.5 μm, although it is unclear. The center of the LABOCA source is outside the MIPS/M2 images (due to the malfunctioning of one of the detectors), but the counterpart #a is not detectable at 24 μm. Thus, it is not completely clear whether this object is the origin of the submm emission. In any case, the mass of the envelope can be estimated as 0.057 M⊙ (Sect. 3.1), well below the stellar/substellar limit.
Source #b, located close to the B30-LB04 peak, is a probable substellar member without any detectable excess. The mass of the envelope is 0.059 M⊙.
In addition, we have classified as cluster candidates #d and #c –possible, and #e, #i and #f –probable members. This last one is a very red object with a steep slope which can be classified as a Class I source based on the IRAC CCD. Therefore, we are dealing with a very low luminosity object (in the optical to mid-IR range, lower than the characteristic luminosity of Class II or III BDs) and a quite extended emission in the submm, which might not be directly associated to it, although the visual inspection indicates that B30-LB03f is in the middle of a filament like asymmetric structure about 60 × 30 arcsec.
B30-LB05.
This is an extended submm source with an estimated size, after deconvolving with a Gaussian to take intoaccount the core, of 36 arcsec. The mass of the envelope can be estimated as 0.081 M⊙ (full beam) or 0.051 M⊙ (peak).
B30-LB05a is located within 5 arcsec of the submm peak intensity and it is not detected at 24 μm, as measuredwith Spitzer/MIPS, but it is outside the M2 FOV. This source seems to be the origin of the submm excess. We note, however, that #a is a Class III star based on its IRAC data.
In addition, B30-LB05c, at ~25 arcsec from the main source (Fig. A.10), seems to be a bona-fide, substellar member. We note that both optical/IR counterparts (#a and #c) are within the APEX/LABOCA beam.
B30-LB07. Counterpart #a, located close to the center, might be the origin of the submm emission (Fig. A.10). The SED suggests it is a substellar object, if it is indeed a member of B30 (its membership status is Y? although it is based on only three data-points). The total mass of the submm envelope (Sect. 3.1) is 0.052 M⊙, which provides a stronger hint regarding its proto-BD status. However, there is no information regarding emission at 70 μm and it lacks emission at 24 μm, which casts some doubts about the actual connection between the near-IR and the submm sources.
B30-LB07e is also an interesting object, since it is a probable member whose luminosity indicates it is substellar. Other interesting sources are #c and #i, which have a relatively flat spectrum and have been classified as possible members. In addition, B30-LB07f has been detected in only two bands, so no membership status has been assigned, but its SED slope is positive.
B30-LB10. As can be seen in Fig. 1, B30-LB11 is located southeast of B30-LB10 and overlaps with it. All sources in the common area have been assigned to B30-LB10. It has been detected by ALMA (Huélamo et al. 2017). The source #a is just at the center, with a weak mid-IR excess as derived with IRAC. There is no M2 flux (outside the FOV) and it is not detected with M1 at 24 μm. It is a possible member and, if membership is confirmed, it would be substellar. The envelope mass has been estimated as 0.046 M⊙.
This submm source includes eight probable (#c, #e, #g and #m) and possible members (#a, #h, #i and #k, see Fig. A.10). Some of them might be substellar, but they display no special feature in the SED.
B30-LB17. Although the closest counterpart to the submm peak is #a, #d shows a significant IR excess, including the emission at 12 and 22 μm (WISE W3 and W4, with extended emission at MIPS M1 and no data for M2), as can be seen in the SED included in Fig. A.9. Both seem to be below the substellar limit. The envelope mass is about half of the limit between stars and BDs, with a value of 0.059 M⊙ (Sect. 3.1). Thus, B30-LB17a is a BD candidate and B30-LB17d might be a proto-BD candidate. Figure A.8 includes another interesting substellar candidate: #b is a probable member without IR excess.
B30-LB21. Counterpart #a, located at the submm peak and with a dubious extended emission at 24 μm, is possibly a Class I object. This source is also extended and the Gaussian fit gives an angular size of 62 arcsec, the largest among all our APEX/LABOCA sources. We note that this component is located in the ionizing edge produced by the star λ Ori (Fig.1), as projected on the sky, and is also very close to B30-LB22. The mass of the envelope can be estimated as 0.108 M⊙ (0.061 M⊙ just for the peak, see detail in Sect. 3.1) and based on the SED it might be substellar, making it a candidate as an irradiated BD embryo, although a more detailed analysis is required.
B30-LB21f and B30-LB21g are two probable members of substellar nature. However, they do not show IR excesses, The SED of counterpart #c is similar to #f and #g, except that it has been detected with WISE W4 although the measured flux seems dubious, since it might be affected by source confusion. Other possible members are #d and #h.
B30-LB27. No object is within the central 5 arcsec of the LABOCA peak. The brightest counterpart in the optical/near-IR within the B30-LB27 beam is #a, but it seems to be a Class II BD or very low-mass star, if member, detected with WISE W3 and W4 but with no measurement at MIPS M1 (Lbol = 0.014 L⊙ Tbol = 988 K).
The flux at 870 μm has been assigned to #b, which has a possible extended emission at 24 μm. We note that we have also assigned to this source the SABOCA flux at 350 μm, although it is approximatley NW from it (elongated in the same direction, (Huélamo et al. 2017).
There are two other interesting objects: components #c and #f. Both have been detected with WISE W3 and W4 and in the case of #f, there is also a possible detection at 24 μm. Since the mass of the envelope is 0.279 M⊙ (0.150 M⊙ at peak intensity) and these three objects have low values of the bolometric temperature and luminosity, regardless the assignment of the submm flux, they look like bona fide BDs candidates.
On the other hand, B30-LB06, B30-LB16 and B30-LB26 have not been detected with MIPS and there are no detectable optical nor near-IR sources within the 5 arcsec central peak. Several facts have to be taken into account. B30-LB16 has an envelope mass of 0.053 M⊙. Counterpart #a might also be substellar. There is a counterpart only detected at 24 μm (#f), but itseems to be an artifact and we have not considered it for further discussions. Thus, we believe it is a good candidate to be starless core. In the case of B30-LB06, the counterparts #a and #c seem to be substellar but they lack IR excess. The submm source is extended with masses of 0.210 and 0.077 M⊙ (whole beam and peak, respectively). Again, it is a starless core candidate. A similar situation appears for B30-LB26a, with a envelope mass of 0.058 M⊙. However, this last one might have a small IRAC excess and its submm emission is connected with B30-LB25 (in fact it is elongated into that direction), which has been detected both at 24 and at 70 μm (see Fig. A.3 for the finding chart and Fig. A.4 for the SED).
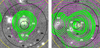 |
Fig. A.1 Finding charts for the relevant sources detected also both at 70 and 24 μm with MIPS(A1 group). The black large and small circles correspond to APEX/LABOCA beam size and the search radius, 27.6 and 5 arcsec, respectively, whereas the yellow big and small circles represent the Akari/FIS and Akari/IRC beams. White labels denote possible and probable members of B30, whereas black labels are used for non-members or objects with unknown status. The background images correspond to CAHA/Omega2000 in the J band. The green, dashed contours come from the Spitzer/MIPS image at 24 μm after removing the difuse emission by the nebulosity (see Sect. 2.4), whereas the magenta levels come from the APEX/LABOCA and correspond to S/N starting at 2 with increments of 1. |
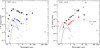 |
Fig. A.2 Spectral energy distribution for the relevant sources detected also both at 70 and 24 μm with MIPS (A1 group). Completeness and detection limits have been included for Spitzer data, as gray and black line segments, respectively. For comparison, we have overplotted in the SED panel the expected emission of a 3 Myr object with 0.072 M⊙ at the distance of B30 –400pc, without interstellar absorption and with a value of AV = 10 magnitudes (black solid lines). |
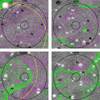 |
Fig. A.3 Finding charts for the relevant sources detected also at 70 and undetected at 24 μm (A2 group). Symbols are in Fig. A.1. We note that the feature displayed at 24 μm for B30-LB23f corresponds to an artifact. |
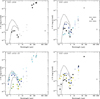 |
Fig. A.4 Spectral energy distribution for the relevant sources with emission at 70 μm but undetected at 24 μm (A2 group). We note that several counterparts for B30-LB29 have a possible extended emission at 24 μm. Symbols as in Fig. A.2. |
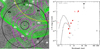 |
Fig. A.5 Finding chart and spectral energy distribution for B30-LB24, the only member within the B1 group (upper limit at 70 μm emission at 24 μm). Symbols areas in Figs. A.1 and A.2. |
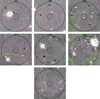 |
Fig. A.6 Finding charts for group B2, undetected both at 70 μm and at 24 μm (upper limits in both cases). Symbols as in Fig. A.1. |
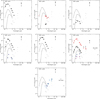 |
Fig. A.7 Spectral energy distribution for group B2 sources undetected at 70 and 24 μm (upper limits). We note that B30-LB20 and B30-LB28 have a possible extended emission at 24 μm. Symbols as in Fig. A.2. |
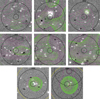 |
Fig. A.8 Finding charts for group C1 or sources outside the FOV of the MIPS M2 image. All have been detected at 24 μm with MIPS. Symbols as in Fig. A.1. |
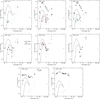 |
Fig. A.9 Spectral energy distribution for some relevant sources outside the FOV of the MIPS M2 image. All have been detected at 24 μm with MIPS. Symbols as in Fig. A.2. |
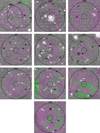 |
Fig. A.10 Finding charts for group C2 or sources outside the FOV of the MIPS M2 image. None of them have been detected 24 μm with MIPS. Symbols as in Fig. A.1. We note that the feature displayed at 24 μm for B30-LB16f corresponds to an artifact. |
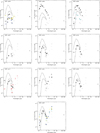 |
Fig. A.11 Spectral energy distribution for group C2 or sources outside the FOV of the MIPS M2 image. None of them have been detected at 24 μm with MIPS. However, we note that B30-LB21 and B30-LB27 have a possible extended emission at 24 μm. Symbols as in Fig. A.2. |
References
- Adams, F. C., Lada, C. J., & Shu, F. H. 1987, ApJ, 312, 788 [NASA ADS] [CrossRef] [Google Scholar]
- Allard, F., Homeier, D., Freytag, B., & Sharp, C. M. 2012, in Low-Mass Stars and the Transition Stars/Brown Dwarfs, eds. C. Reylé, C. Charbonnel, & M. Schultheis, EAS Pub. Ser., 57, 3 [Google Scholar]
- Allen, L. E., Calvet, N., D’Alessio, P., et al. 2004, ApJS, 154, 363 [NASA ADS] [CrossRef] [Google Scholar]
- André, P., Ward-Thompson, D., & Greaves, J. 2012, Science, 337, 69 [NASA ADS] [CrossRef] [PubMed] [Google Scholar]
- Baraffe, I., Chabrier, G., Allard, F., & Hauschildt, P. H. 1998, A&A, 337, 403 [NASA ADS] [Google Scholar]
- Barrado, D., Morales-Calderón, M., Palau, A., et al. 2009, A&A, 508, 859 [NASA ADS] [CrossRef] [EDP Sciences] [Google Scholar]
- Barrado, D., Stelzer, B., Morales-Calderón, M., et al. 2011, A&A, 526, A21 [NASA ADS] [CrossRef] [EDP Sciences] [Google Scholar]
- Barrado y Navascués, D., Stauffer, J. R., Bouvier, J., Jayawardhana, R., & Cuillandre, J.-C. 2004, ApJ, 610, 1064 [NASA ADS] [CrossRef] [Google Scholar]
- Barrado y Navascués, D., Stauffer, J. R., Morales-Calderón, M., et al. 2007, ApJ, 664, 481 [NASA ADS] [CrossRef] [Google Scholar]
- Bate, M. R. 2012, MNRAS, 419, 3115 [NASA ADS] [CrossRef] [Google Scholar]
- Bate, M. R., Bonnell, I. A., & Bromm, V. 2002, MNRAS, 332, L65 [NASA ADS] [CrossRef] [Google Scholar]
- Bayo, A. 2009, Ph.D. dissertations, Universidad Autónoma de Madrid [Google Scholar]
- Bayo, A., Rodrigo, C., Barrado y Navascués, D., et al. 2008, A&A, 492, 277 [NASA ADS] [CrossRef] [EDP Sciences] [Google Scholar]
- Bayo, A., Barrado, D., Stauffer, J., et al. 2011, A&A, 536, A63 [NASA ADS] [CrossRef] [EDP Sciences] [Google Scholar]
- Bell, C. P. M., Naylor, T., Mayne, N. J., Jeffries, R. D., & Littlefair, S. P. 2013, MNRAS, 434, 806 [NASA ADS] [CrossRef] [Google Scholar]
- Belloche, A., Hennebelle, P., & André, P. 2006a, A&A, 453, 145 [NASA ADS] [CrossRef] [EDP Sciences] [Google Scholar]
- Belloche, A., Parise, B., van der Tak, F. F. S., et al. 2006b, A&A, 454, L51 [NASA ADS] [CrossRef] [EDP Sciences] [Google Scholar]
- Bonnell, I. A., Clark, P., & Bate, M. R. 2008, MNRAS, 389, 1556 [NASA ADS] [CrossRef] [Google Scholar]
- Bouy, H., Huélamo, N., Barrado Y Navascués, D., et al. 2009, A&A, 504, 199 [NASA ADS] [CrossRef] [EDP Sciences] [Google Scholar]
- Cambresy, L., Epchtein, N., Copet, E., et al. 1997, A&A, 324, L5 [NASA ADS] [Google Scholar]
- Chen, H., Myers, P. C., Ladd, E. F., & Wood, D. O. S. 1995, ApJ, 445, 377 [NASA ADS] [CrossRef] [Google Scholar]
- Chen, X., Arce, H. G., Zhang, Q., et al. 2010, ApJ, 715, 1344 [Google Scholar]
- Chen, X., Arce, H. G., Dunham, M. M., et al. 2012, ApJ, 751, 89 [NASA ADS] [CrossRef] [Google Scholar]
- Connelley, M. S., Reipurth, B., & Tokunaga, A. T. 2008, AJ, 135, 2496 [NASA ADS] [CrossRef] [Google Scholar]
- Cousins, A. W. J. 1976, MmRAS, 81, 25 [Google Scholar]
- Cunha, K., & Smith, V. V. 1996, A&A, 309, 892 [NASA ADS] [Google Scholar]
- Cutri, R. M., Skrutskie, M. F., van Dyk, S., et al. 2003, 2MASS All Sky Catalog of point sources (NASA/IPAC Infrared Science Archive), http://irsa.ipac.caltech.edu/applications/Gator/ [Google Scholar]
- Cutri, R. M., Wright, E. L., Conrow, T., et al. 2013, Explanatory Supplement to the AllWISE Data Release Products, Tech. Rep. [Google Scholar]
- de Gregorio-Monsalvo, I., Barrado, D., Bouy, H., et al. 2016, A&A, 590, A79 [NASA ADS] [CrossRef] [EDP Sciences] [Google Scholar]
- Devillard, N. 1997, The Messenger, 87, 19 [NASA ADS] [Google Scholar]
- Devillard, N. 1999, in ASP Conf. Ser., 172, Astronomical Data Analysis Software and Systems VIII, ed. D. M. Mehringer, R. L. Plante, & D. A. Roberts, 333 [NASA ADS] [Google Scholar]
- di Francesco, J., Evans II, N. J., Caselli, P., et al. 2007, Protostars and Planets V (Tucson: The Arizona University Press), 17 [NASA ADS] [Google Scholar]
- Dolan, C. J., & Mathieu, R. D. 1999, AJ, 118, 2409 [NASA ADS] [CrossRef] [Google Scholar]
- Dolan, C. J., & Mathieu, R. D. 2001, AJ, 121, 2124 [NASA ADS] [CrossRef] [Google Scholar]
- Dolan, C. J., & Mathieu, R. D. 2002, AJ, 123, 387 [NASA ADS] [CrossRef] [Google Scholar]
- Drass, H., Haas, M., Chini, R., et al. 2016, MNRAS, 461, 1734 [NASA ADS] [CrossRef] [Google Scholar]
- Duerr, R., Imhoff, C. L., & Lada, C. J. 1982, ApJ, 261, 135 [NASA ADS] [CrossRef] [Google Scholar]
- Dunham, M. M., Crapsi, A., Evans II, N. J., et al. 2008, ApJS, 179, 249 [NASA ADS] [CrossRef] [Google Scholar]
- Finkbeiner, D. P. 2003, ApJS, 146, 407 [NASA ADS] [CrossRef] [Google Scholar]
- Fitzpatrick, E. L. 1999, PASP, 111, 63 [NASA ADS] [CrossRef] [Google Scholar]
- Frayer, D. T., Sanders, D. B., Surace, J. A., et al. 2009, AJ, 138, 1261 [NASA ADS] [CrossRef] [Google Scholar]
- Gutermuth, R. A., Myers, P. C., Megeath, S. T., et al. 2008, ApJ, 674, 336 [NASA ADS] [CrossRef] [Google Scholar]
- Harvey, P. M., Chapman, N., Lai, S., et al. 2006, ApJ, 644, 307 [NASA ADS] [CrossRef] [Google Scholar]
- Harvey, P., Merín, B., Huard, T. L., et al. 2007, ApJ, 663, 1149 [NASA ADS] [CrossRef] [Google Scholar]
- Hennebelle, P., & Chabrier, G. 2008, ApJ, 684, 395 [NASA ADS] [CrossRef] [Google Scholar]
- Hester, J. J., Scowen, P. A., Sankrit, R., et al. 1996, AJ, 111, 2349 [NASA ADS] [CrossRef] [Google Scholar]
- Huélamo, N., de Gregorio-Monsalvo, I., Palau, A., et al. 2017, A&A, 597, A17 [NASA ADS] [CrossRef] [EDP Sciences] [Google Scholar]
- Irwin, M., & Lewis, J. 2001, New Astron. Rev., 45, 105 [NASA ADS] [CrossRef] [Google Scholar]
- Ishihara, D., Onaka, T., Kataza, H., et al. 2010, A&A, 514, A1 [NASA ADS] [CrossRef] [EDP Sciences] [Google Scholar]
- Johnson, H. L. 1963, in Photometric Systems, ed. K. A. Strand (The University of Chicago Press), 204 [Google Scholar]
- Jørgensen, J. K., Johnstone, D., Kirk, H., et al. 2008, ApJ, 683, 822 [NASA ADS] [CrossRef] [Google Scholar]
- Kauffmann, J., Bertoldi, F., Bourke, T. L., et al. 2011, MNRAS, 416, 2341 [NASA ADS] [CrossRef] [Google Scholar]
- Kawada, M., Baba, H., Barthel, P. D., et al. 2007, PASJ, 59, 389 [Google Scholar]
- Koenig, X., Hillenbrand, L. A., Padgett, D. L., & DeFelippis, D. 2015, AJ, 150, 100 [NASA ADS] [CrossRef] [Google Scholar]
- Kovács, A. 2008, in Millimeter and Submillimeter Detectors and Instrumentation for Astronomy IV, eds. Duncan, W. D., Holland, W. S., Withington, S., & Zmuidzinas, J., Proc. SPIE, 7020, 70201S [Google Scholar]
- Lada, C. J. 1987, in Star Forming Regions, eds. M. Peimbert, & J. Jugaku, IAU Symp., 115, 1 [NASA ADS] [CrossRef] [Google Scholar]
- Landolt, A. U. 1973, AJ, 78, 959 [NASA ADS] [CrossRef] [Google Scholar]
- Landolt, A. U. 1992, AJ, 104, 372 [NASA ADS] [CrossRef] [Google Scholar]
- Larson, R. B. 1969, MNRAS, 145, 271 [NASA ADS] [CrossRef] [Google Scholar]
- Lee, C. W., Bourke, T. L., Myers, P. C., et al. 2009, ApJ, 693, 1290 [NASA ADS] [CrossRef] [Google Scholar]
- Lee, C. W., Kim, M.-R., Kim, G., et al. 2013, ApJ, 777, 50 [NASA ADS] [CrossRef] [Google Scholar]
- Levine, J. L., Steinhauer, A., Elston, R. J., & Lada, E. A. 2006, ApJ, 646, 1215 [NASA ADS] [CrossRef] [Google Scholar]
- Liu, T., Zhang, Q., Kim, K.-T., et al. 2016, ApJS, 222, 7 [NASA ADS] [CrossRef] [Google Scholar]
- López Martí, B., Jiménez-Esteban, F., Bayo, A., et al. 2013, A&A, 556, A144 [NASA ADS] [CrossRef] [EDP Sciences] [Google Scholar]
- Luhman, K. L., Whitney, B. A., Meade, M. R., et al. 2006, ApJ, 647, 1180 [NASA ADS] [CrossRef] [Google Scholar]
- Machida, M. N., Inutsuka, S.-i., & Matsumoto, T. 2008, ApJ, 676, 1088 [NASA ADS] [CrossRef] [Google Scholar]
- Maddalena, R. J., & Morris, M. 1987, ApJ, 323, 179 [NASA ADS] [CrossRef] [Google Scholar]
- Mainzer, A., Bauer, J., Grav, T., et al. 2011, ApJ, 731, 53 [NASA ADS] [CrossRef] [Google Scholar]
- Makovoz, D., & Marleau, F. R. 2005, PASP, 117, 1113 [NASA ADS] [CrossRef] [Google Scholar]
- Matzner, C. D., & Levin, Y. 2005, ApJ, 628, 817 [NASA ADS] [CrossRef] [Google Scholar]
- Morales-Calderón, M. 2008, Ph.D. dissertation, Universidad Autónoma de Madrid, Spain [Google Scholar]
- Morata, O., Palau, A., González, R. F., et al. 2015, ApJ, 807, 55 [NASA ADS] [CrossRef] [Google Scholar]
- Murdin, P., & Penston, M. V. 1977, MNRAS, 181, 657 [NASA ADS] [CrossRef] [Google Scholar]
- Myers, P. C., Adams, F. C., Chen, H., & Schaff, E. 1998, ApJ, 492, 703 [NASA ADS] [CrossRef] [Google Scholar]
- Onishi, T., Mizuno, A., & Fukui, Y. 1999, PASJ, 51, 257 [NASA ADS] [Google Scholar]
- Ossenkopf, V., & Henning, T. 1994, A&A, 291, 943 [NASA ADS] [Google Scholar]
- Padoan, P., & Nordlund, Å. 2004, ApJ, 617, 559 [NASA ADS] [CrossRef] [Google Scholar]
- Palau, A., de Gregorio-Monsalvo, I., Morata, Ò., et al. 2012, MNRAS, 424, 2778 [NASA ADS] [CrossRef] [Google Scholar]
- Palau, A., Zapata, L. A., Rodríguez, L. F., et al. 2014, MNRAS, 444, 833 [NASA ADS] [CrossRef] [Google Scholar]
- Polychroni, D., Schisano, E., Elia, D., et al. 2013 ApJ, 777, L33 [NASA ADS] [CrossRef] [Google Scholar]
- Reipurth, B., & Clarke, C. 2001, AJ, 122, 432 [NASA ADS] [CrossRef] [Google Scholar]
- Riaz, B., Vorobyov, E., Harsono, D., et al. 2016 AJ, 831, 189 [NASA ADS] [CrossRef] [Google Scholar]
- Sacchi, N., La Franca, F., Feruglio, C., et al. 2009, ApJ, 703, 1778 [NASA ADS] [CrossRef] [Google Scholar]
- Sánchez-Monge, Á., Palau, A., Fontani, F., et al. 2013, MNRAS, 432, 3288 [NASA ADS] [CrossRef] [Google Scholar]
- Scholz, A., Geers, V., Clark, P., Jayawardhana, R., & Muzic, K. 2013, ApJ, 775, 138 [NASA ADS] [CrossRef] [Google Scholar]
- Siess, L., Dufour, E., & Forestini, M. 2000, A&A, 358, 593 [NASA ADS] [Google Scholar]
- Skrutskie, M. F., et al. 2006, AJ, 131, 1163 [NASA ADS] [CrossRef] [Google Scholar]
- Surace, J. A., Shupe, D. L., Fang, F., et al. 2004, VizieR Online Data Catalog: II/255 [Google Scholar]
- Tobin, J. J., Looney, L. W., Li, Z.-Y., et al. 2016, ApJ, 818, 73 [NASA ADS] [CrossRef] [Google Scholar]
- Weiß, A., Kovács, A., Coppin, K., et al. 2009, ApJ, 707, 1201 [NASA ADS] [CrossRef] [Google Scholar]
- Whitworth, A. P., & Stamatellos, D. 2006, A&A, 458, 817 [NASA ADS] [CrossRef] [EDP Sciences] [Google Scholar]
- Whitworth, A. P., & Zinnecker, H. 2004, A&A, 427, 299 [NASA ADS] [CrossRef] [EDP Sciences] [Google Scholar]
- Wright, E. L., Eisenhardt, P. R. M., Mainzer, A. K., et al. 2010, AJ, 140, 1868 [NASA ADS] [CrossRef] [Google Scholar]
- Young, C. H., & Evans II, N. J. 2005, ApJ, 627, 293 [NASA ADS] [CrossRef] [Google Scholar]
- Young, C. H., Jørgensen, J. K., Shirley, Y. L., et al. 2004, ApJS, 154, 396 [NASA ADS] [CrossRef] [Google Scholar]
This work is partially based on observations with the APEX telescope. APEX is a collaboration between the Max-Plank-Institute fur Radioastronomie, the European Southern Observatory, and the Onsala Space Observatory.
Based on observations collected at the Centro Astronomico Hispano Aleman (CAHA) at Calar Alto, operated jointly by the Max-Planck-Institut fur Astronomie and the Instituto de Astrofisica de Andalucia (CSIC).
Based on observations made through the Isaac Newton Groups’ Wide Field Camera Survey Programme with the Isaac Newton Telescope operated on the island of La Palma by the Isaac Newton Group in the Spanish Observatorio del Roque de los Muchachos of the Instituto de Astrofisica de Canarias.
This work is based in part on observations made with the Spitzer Space Telescope, which is operated by the Jet Propulsion Laboratory, California Institute of Technology under a contract with NASA.
All Tables
Temperatures and luminosities for Barnard 30 objects with significant infrared excesses.
All Figures
|
Fig. 1 Top: our APEX/LABOCA image, with the 34 sources at 870 μm. Black open circles correspond to the LABOCA identified sources, with a 27.6 arcsec beam size. The total size of the map is about 38 arcmin in diameter. The cyan lines represent the Hα emission (Virginia Tech Spectral line Survey with 6 arcmin resolution, Finkbeiner 2003). Bottom: color scale: MIPS image at 24 μm of B30. Black contours correspond to 3, 5, 7, 9, 12 and 15 times the rms noise of the 870 μm emission (which varies across the image and it increases toward the edge of the map). The 34 submm identified sources are marked with red labels. |
| In the text | |
|
Fig. 2 Number of near-IR detections with CAHA/O2000 in the APEX/LABOCA FOV. The bin size has been estimated via the Freedman Diaconis Estimator (resilient to outliers). We estimate that the completeness limit is at Jcompl = 18.75 mag and the detection limit at Jlim = 20.5 mag. |
| In the text | |
|
Fig. 3 Spitzer/IRAC CCD and CMDs. The first panel (top, left) displays the areas where Class I, II and III objects are located (assuming a stellar or substellar nature). The optical/IR counterparts of the B30 APEX/LABOCA sources are represented as magenta circles (solid for probable and possible members, empty circles for unknown status and a black cross for probable and possible non-members). For comparison, we have added known members of the ~5–8 Myr cluster C69 as plus, blue symbols, which is located in the same star forming region complex (Dolan & Mathieu 1999; Barrado y Navascués et al. 2004, 2007; Morales-Calderón 2008; Barrado et al. 2011; Bayo et al. 2011). We have also added confirmed members of Serpens from Harvey et al. (2007), about ~2 Myr, as green-black asterisks. Most of our B30 counterparts can be classified as Class I or as transitional objects between Class I andClass II. Other panels include extragalactic sources as light gray symbols and have been extracted from Sacchi et al. (2009): up- and down-ward open triangles correspond to the AGN1 and AGN2, whereas three-point stars represent emission line galaxies and open circles other galaxies. We also have include BT-settl isochrones (Allard et al. 2012)with 3 and 20 Myr. |
| In the text | |
|
Fig. 4 Color-magnitude diagrams for the B30 APEX/LABOCA counterparts. Symbols as in Fig. 3, but in these panels we have included confirmed members of Taurus from Luhman et al. (2006), about 1–2 Myr, as asterisks. As a reference, the locations for 72 and 13 MJup very low-mass objects at 3 Myr are also included, based on 3 Myr isochrone by (Allard et al. 2012). |
| In the text | |
|
Fig. 5 Rejection of possible counterparts based on their location on the HRD. Big, black crosses correspond to possible and probable non-members. Candidate members are shown as open green circles (possible members) and solid green circles (probable members). The bolometric luminosity and the effective temperature were derived using a fixed value of the reddening (Av = 0.322) or it was derived during the fitting process (top- and bottom panels, respectively). Collinder 69 known members, located at similar distance, are displayed as blue plus symbols, and were selected from Dolan & Mathieu (1999), Barrado y Navascués et al. (2007), Morales-Calderón (2008) and Barrado et al. (2011). Isochrones correspond to a 20 Myr isochrone from Siess et al. (2000) – upper part of the main sequence, in black – and Settl models – blue lines with 1, 20 and 10 000 Myr – from the Lyon group (Allard et al. 2012). We note that some possible members can be found well below the Collinder 69 cluster sequence. |
| In the text | |
|
Fig. 6 Lbol versus Tbol after Young & Evans (2005) and Dunham et al. (2008). Sources compiled in these two works, with evidences for being embedded low luminosity sources, are shown as solid black squares. Young members from Tobin et al. (2016) in Perseus are displayed as open squares. The black crosses correspond to Taurus members in Chen et al. (1995), whereas solid, black circles comefrom Bayo et al. (2011) and the Collinder 69 cluster. The cyan, short-dashed lines show the evolutionary tracks for the three models with different masses (in solar masses) considered by Young & Evans (2005). The magenta, dotted and long-dashed lines show the evolutionary tracks for three models considered by Myers et al. (1998). The blue solid lines correspond to isochrones by Baraffe et al. (1998). The vertical dashed lines show the Class 0–I and Class I–II Tbol boundaries from Chen et al. (1995). The big, labeled circles correspond to several counterparts for our B30 sources detected at 70 μm (our group A). Green with detections at 24 μm and cyan undetected at that band. Solid (green or cyan) circles denote counterparts whose properties have been derived with the 870 μm flux (for counterparts assumed to the primary origin of the submm emission), whereas open symbols represent values estimated without this flux, and the arrows move their location to the values derived when including this value. |
| In the text | |
|
Fig. 7 Symbols as in Fig. 6 except for our B30 sources. Sample in group C1 are located outside the area surveyed by MIPS M2 but they have been detected at 24 μm. The red asterisks represent values estimated when the flux at 870 μm has not been included, whereas the end of the arrows signals the values derived with the submm flux. |
| In the text | |
|
Fig. A.1 Finding charts for the relevant sources detected also both at 70 and 24 μm with MIPS(A1 group). The black large and small circles correspond to APEX/LABOCA beam size and the search radius, 27.6 and 5 arcsec, respectively, whereas the yellow big and small circles represent the Akari/FIS and Akari/IRC beams. White labels denote possible and probable members of B30, whereas black labels are used for non-members or objects with unknown status. The background images correspond to CAHA/Omega2000 in the J band. The green, dashed contours come from the Spitzer/MIPS image at 24 μm after removing the difuse emission by the nebulosity (see Sect. 2.4), whereas the magenta levels come from the APEX/LABOCA and correspond to S/N starting at 2 with increments of 1. |
| In the text | |
|
Fig. A.2 Spectral energy distribution for the relevant sources detected also both at 70 and 24 μm with MIPS (A1 group). Completeness and detection limits have been included for Spitzer data, as gray and black line segments, respectively. For comparison, we have overplotted in the SED panel the expected emission of a 3 Myr object with 0.072 M⊙ at the distance of B30 –400pc, without interstellar absorption and with a value of AV = 10 magnitudes (black solid lines). |
| In the text | |
|
Fig. A.3 Finding charts for the relevant sources detected also at 70 and undetected at 24 μm (A2 group). Symbols are in Fig. A.1. We note that the feature displayed at 24 μm for B30-LB23f corresponds to an artifact. |
| In the text | |
|
Fig. A.4 Spectral energy distribution for the relevant sources with emission at 70 μm but undetected at 24 μm (A2 group). We note that several counterparts for B30-LB29 have a possible extended emission at 24 μm. Symbols as in Fig. A.2. |
| In the text | |
|
Fig. A.5 Finding chart and spectral energy distribution for B30-LB24, the only member within the B1 group (upper limit at 70 μm emission at 24 μm). Symbols areas in Figs. A.1 and A.2. |
| In the text | |
|
Fig. A.6 Finding charts for group B2, undetected both at 70 μm and at 24 μm (upper limits in both cases). Symbols as in Fig. A.1. |
| In the text | |
|
Fig. A.7 Spectral energy distribution for group B2 sources undetected at 70 and 24 μm (upper limits). We note that B30-LB20 and B30-LB28 have a possible extended emission at 24 μm. Symbols as in Fig. A.2. |
| In the text | |
|
Fig. A.8 Finding charts for group C1 or sources outside the FOV of the MIPS M2 image. All have been detected at 24 μm with MIPS. Symbols as in Fig. A.1. |
| In the text | |
|
Fig. A.9 Spectral energy distribution for some relevant sources outside the FOV of the MIPS M2 image. All have been detected at 24 μm with MIPS. Symbols as in Fig. A.2. |
| In the text | |
|
Fig. A.10 Finding charts for group C2 or sources outside the FOV of the MIPS M2 image. None of them have been detected 24 μm with MIPS. Symbols as in Fig. A.1. We note that the feature displayed at 24 μm for B30-LB16f corresponds to an artifact. |
| In the text | |
|
Fig. A.11 Spectral energy distribution for group C2 or sources outside the FOV of the MIPS M2 image. None of them have been detected at 24 μm with MIPS. However, we note that B30-LB21 and B30-LB27 have a possible extended emission at 24 μm. Symbols as in Fig. A.2. |
| In the text | |
Current usage metrics show cumulative count of Article Views (full-text article views including HTML views, PDF and ePub downloads, according to the available data) and Abstracts Views on Vision4Press platform.
Data correspond to usage on the plateform after 2015. The current usage metrics is available 48-96 hours after online publication and is updated daily on week days.
Initial download of the metrics may take a while.