Fig. 5
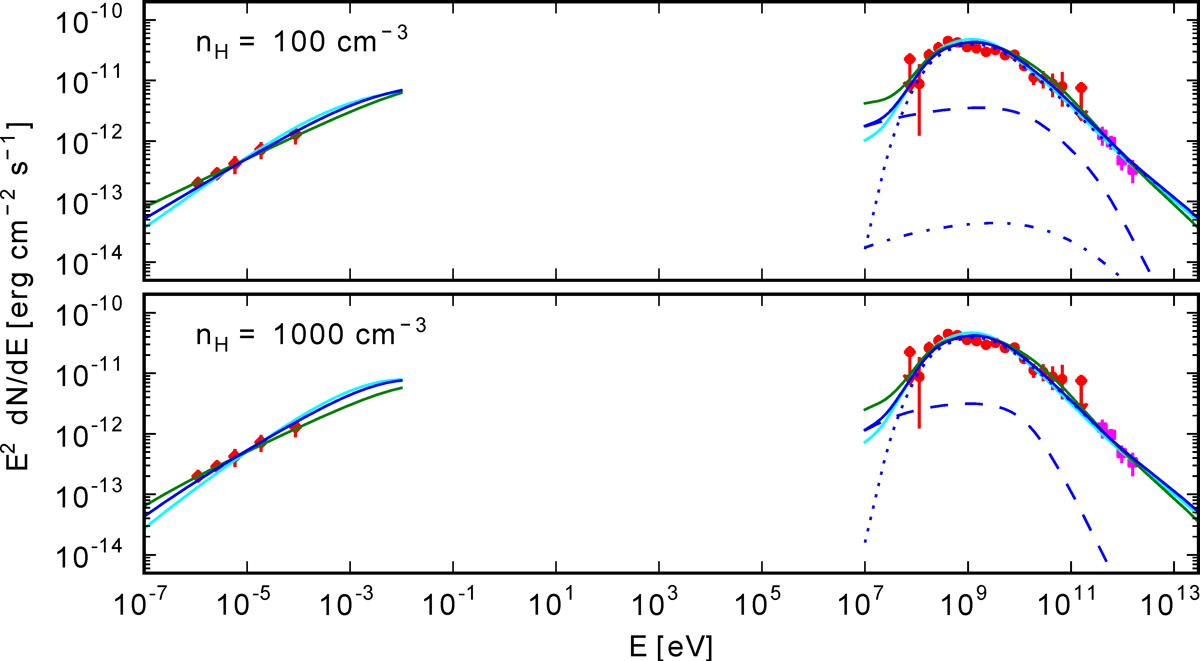
SEDs of W49B with model curves for the hadronic-dominant scenario. The upper and lower panels show (a1–3) and (a4–6), respectively (see Table 2). The red diamonds, red circles, and magenta squares represent observed data in the radio (Moffett & Reynolds 1994), LAT, and H.E.S.S. bands, respectively. The radio emission is explained by the synchrotron radiation from the relativistic electrons. The γ-ray emission canbe decomposed into π0-decay (dotted line), bremsstrahlung (dashed line), and IC scattering (dot-dashed line). The solid line represents the total flux of the components. The cases (a1)/(a4), (a2)/(a5), and (a3)/(a6) are represented by cyan, blue, and green lines, respectively,in the upper/lower panel. The decomposed emissions are shown for the cases (a2) and (a5) in the upper and lower panels, respectively.
Current usage metrics show cumulative count of Article Views (full-text article views including HTML views, PDF and ePub downloads, according to the available data) and Abstracts Views on Vision4Press platform.
Data correspond to usage on the plateform after 2015. The current usage metrics is available 48-96 hours after online publication and is updated daily on week days.
Initial download of the metrics may take a while.