Fig. 4
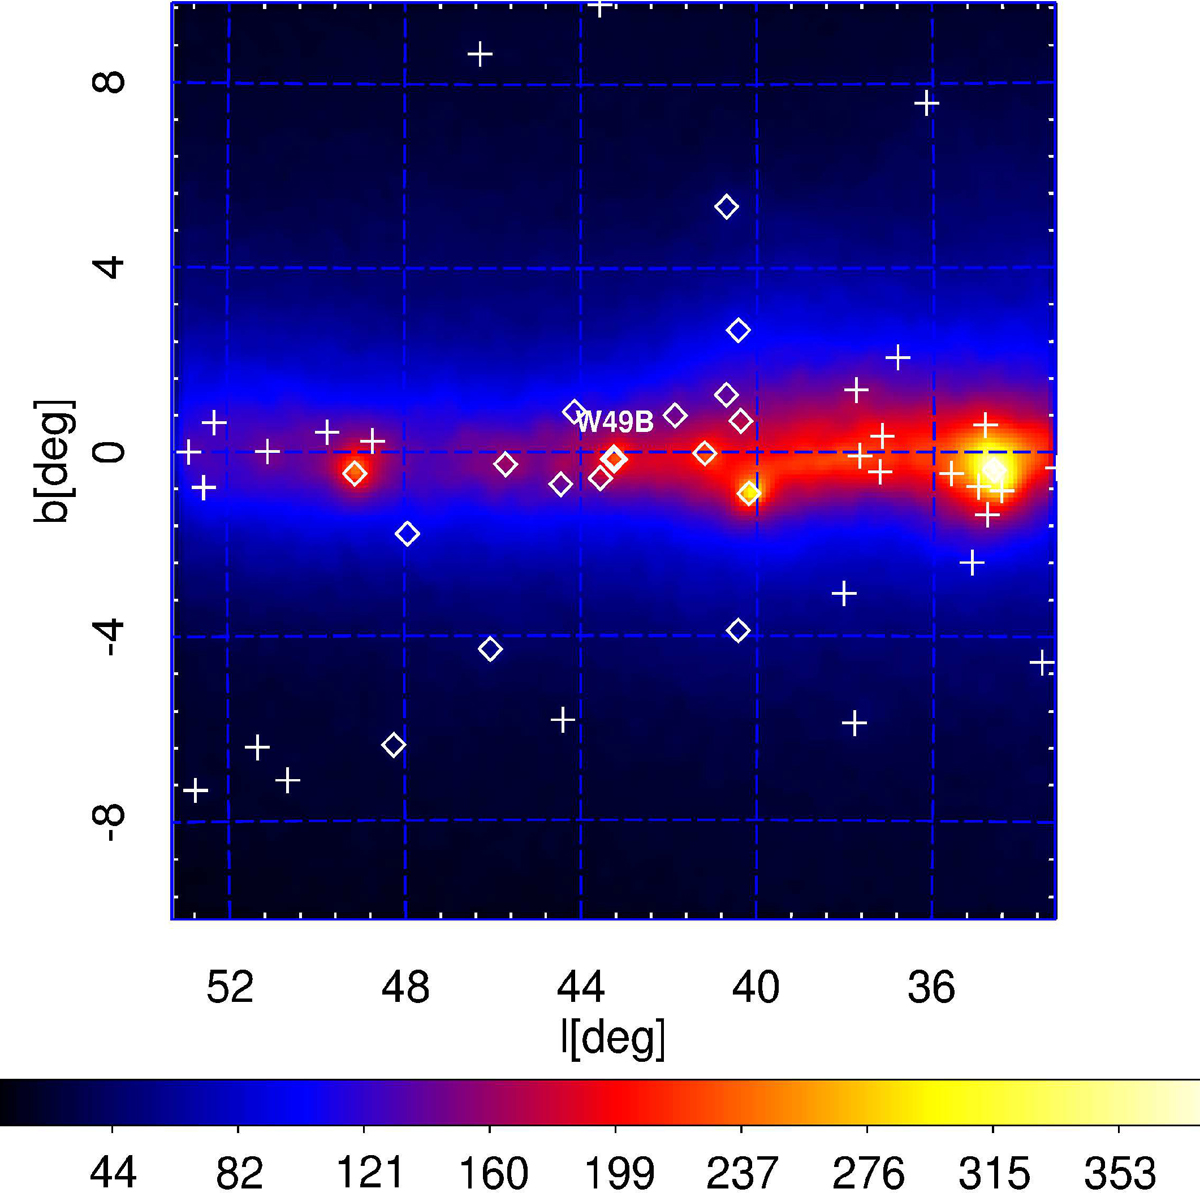
Fermi-LAT count map of the 20° × 20° around W49B between 60 MeV and 300 GeV, smoothed with a Gaussian of width 0.3°. Spectral parameters of sources indicated by a diamond are left free in the analysis while sources indicated with crosses are frozen in the likelihood fit. Events were spatially binned in pixels of side-length 0.1°. The dominant source seen at a Galactic longitude of 34.6° in this counts map is W44.
Current usage metrics show cumulative count of Article Views (full-text article views including HTML views, PDF and ePub downloads, according to the available data) and Abstracts Views on Vision4Press platform.
Data correspond to usage on the plateform after 2015. The current usage metrics is available 48-96 hours after online publication and is updated daily on week days.
Initial download of the metrics may take a while.