Fig. 3
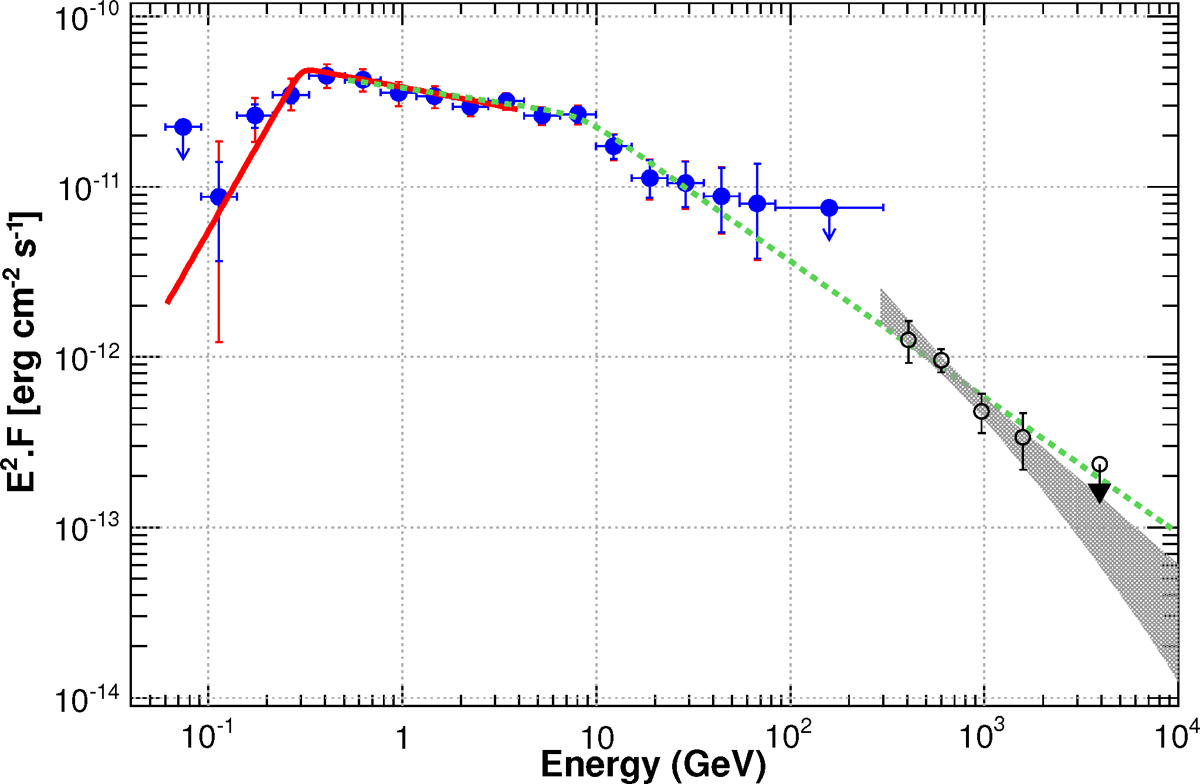
Fermi-LAT and H.E.S.S. spectrum of W49B. The red line shows the best fit of a smoothly broken power law derived between 60 MeV and 4 GeV and the blue data points indicate the fluxes measured in each energy bin with the Fermi-LAT. The statistical errors are shown in blue, while the red lines take both the statistical and systematic errors into account as discussed in Sect. 2.2.2. The grey band shows the 68% confidence level (CL) uncertainty of the best-fit power-law model with H.E.S.S. The open black circles indicate the spectral points computed from the forward-folding fit with their statistical errors shown in black. For both instruments, a 95% CL upper limit is computed when the statistical significance is lower than 2σ. The dotted green line shows the best smoothly broken power-law model obtained from the joint fit of the Fermi-LAT and H.E.S.S. data between 500 MeV and 10 TeV, as described in Sect. 2.3.
Current usage metrics show cumulative count of Article Views (full-text article views including HTML views, PDF and ePub downloads, according to the available data) and Abstracts Views on Vision4Press platform.
Data correspond to usage on the plateform after 2015. The current usage metrics is available 48-96 hours after online publication and is updated daily on week days.
Initial download of the metrics may take a while.