Fig. 2
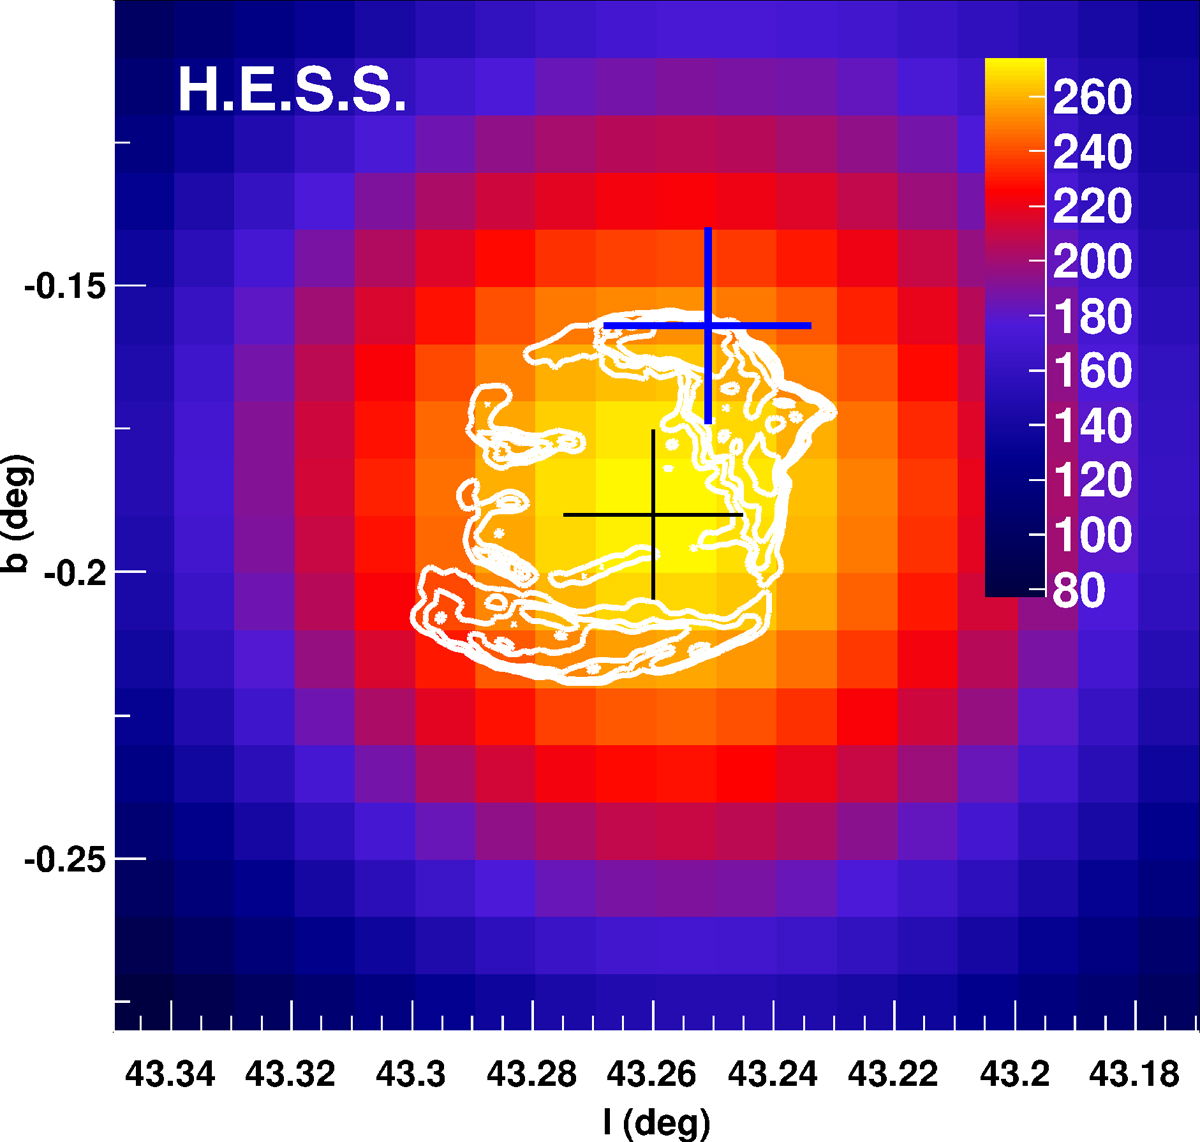
Zoomed-in version of Fig. 1. The crosses show the best-fit positions of the source with H.E.S.S. (black) and Fermi-LAT (blue). The size of the crosses represents the size of the 95% confidence level (CL) contours on the best-fit positions, including systematic uncertainties. The white contours show the radio intensity obtained at a wavelength of 20 cm with MAGPIS (Helfand et al. 2006).
Current usage metrics show cumulative count of Article Views (full-text article views including HTML views, PDF and ePub downloads, according to the available data) and Abstracts Views on Vision4Press platform.
Data correspond to usage on the plateform after 2015. The current usage metrics is available 48-96 hours after online publication and is updated daily on week days.
Initial download of the metrics may take a while.