| Issue |
A&A
Volume 612, April 2018
H.E.S.S. phase-I observations of the plane of the Milky Way
|
|
|---|---|---|
| Article Number | A4 | |
| Number of page(s) | 7 | |
| Section | Galactic structure, stellar clusters and populations | |
| DOI | https://doi.org/10.1051/0004-6361/201526545 | |
| Published online | 09 April 2018 | |
Detailed spectral and morphological analysis of the shell type supernova remnant RCW 86
1
Universität Hamburg, Institut für Experimentalphysik, Luruper Chaussee 149, 22761 Hamburg, Germany
2
Max-Planck-Institut für Kernphysik, PO Box 103980, 69029 Heidelberg, Germany
3
Dublin Institute for Advanced Studies, 31 Fitzwilliam Place, Dublin 2, Ireland
4
National Academy of Sciences of the Republic of Armenia, Marshall Baghramian Avenue, 24, 0019 Yerevan, Republic of Armenia
5
Yerevan Physics Institute, 2 Alikhanian Brothers St., 375036 Yerevan, Armenia
6
Institut für Physik, Humboldt-Universität zu Berlin, Newtonstr. 15, 12489 Berlin, Germany
7
University of Namibia, Department of Physics, Private Bag 13301, Windhoek, Namibia
8
GRAPPA, Anton Pannekoek Institute for Astronomy, University of Amsterdam, Science Park 904, 1098 XH Amsterdam, The Netherlands
9
Department of Physics and Electrical Engineering, Linnaeus University, 351 95 Växjö, Sweden
10
Institut für Theoretische Physik, Lehrstuhl IV: Weltraum und Astrophysik, Ruhr-Universität Bochum, 44780 Bochum, Germany
11
GRAPPA, Anton Pannekoek Institute for Astronomy and Institute of High-Energy Physics, University of Amsterdam, Science Park 904, 1098 XH Amsterdam, The Netherlands
12
Institut für Astro- und Teilchenphysik, Leopold-Franzens-Universität Innsbruck, 6020 Innsbruck, Austria
13
School of Chemistry & Physics, University of Adelaide, 5005 Adelaide, Australia
14
Centre for Space Research, North-West University, 2520 Potchefstroom, South Africa
15
LUTH, Observatoire de Paris, CNRS, Université Paris Diderot, 5 Place Jules Janssen, 92190 Meudon, France
16
LPNHE, Université Pierre et Marie Curie Paris 6, Université Denis Diderot Paris 7, CNRS/IN2P3, 4 Place Jussieu, 75252 Paris, Cedex 5, France
17
Laboratoire Univers et Particules de Montpellier, Université Montpellier 2, CNRS/IN2P3, CC 72, Place Eugène Bataillon, 34095 Montpellier Cedex 5, France
18
DSM/Irfu, CEA Saclay, 91191 Gif-Sur-Yvette Cedex, France
19
Astronomical Observatory, The University of Warsaw, Al. Ujazdowskie 4, 00-478 Warsaw, Poland
20
Aix Marseille Universié, CNRS/IN2P3, CPPM UMR 7346, 13288 Marseille, France
21
Instytut Fizyki Ja̧drowej PAN, ul. Radzikowskiego 152, 31-342 Kraków, Poland
22
Funded by EU FP7 Marie Curie, grant agreement No. PIEF-GA-2012-332350
23
School of Physics, University of the Witwatersrand, 1 Jan Smuts Avenue, Braamfontein, 2050 Johannesburg, South Africa
24
Laboratoire d’Annecy-le-Vieux de Physique des Particules, Université Savoie Mont-Blanc, CNRS/IN2P3, 74941 Annecy-le-Vieux, France
25
Landessternwarte, Universität Heidelberg, Königstuhl, 69117 Heidelberg, Germany
26
Université Bordeaux, CNRS/IN2P3, Centre d’Études Nucléaires de Bordeaux Gradignan, 33175 Gradignan, France
27
Oskar Klein Centre, Department of Physics, Stockholm University, Albanova University Center, 10691 Stockholm, Sweden
28
Wallenberg Academy Fellow
29
Institut für Astronomie und Astrophysik, Universität Tübingen, Sand 1, 72076 Tübingen, Germany
30
Laboratoire Leprince-Ringuet, École Polytechnique, CNRS/IN2P3, 91128 Palaiseau, France
31
APC, AstroParticule et Cosmologie, Université Paris Diderot, CNRS/IN2P3, CEA/Irfu, Observatoire de Paris, Sorbonne Paris Cité, 10 rue Alice Domon et Léonie Duquet, 75205 Paris Cedex 13, France
32
Univ. Grenoble Alpes, IPAG; CNRS, IPAG, 38000 Grenoble, France
33
Department of Physics and Astronomy, The University of Leicester, University Road, Leicester, LE1 7RH, UK
34
Nicolaus Copernicus Astronomical Center, ul. Bartycka 18, 00-716 Warsaw, Poland
35
Institut für Physik und Astronomie, Universität Potsdam, Karl-Liebknecht-Strasse 24/25, 14476 Potsdam, Germany
36
DESY, 15738 Zeuthen, Germany
37
Obserwatorium Astronomiczne, Uniwersytet Jagielloński, ul. Orla 171, 30-244 Kraków, Poland
38
Universität Erlangen-Nürnberg, Physikalisches Institut, Erwin-Rommel-Str. 1, 91058 Erlangen, Germany
39
Centre for Astronomy, Faculty of Physics, Astronomy and Informatics, Nicolaus Copernicus University, Grudziadzka 5, 87-100 Torun, Poland
40
Department of Physics, University of the Free State, PO Box 339, 9300 Bloemfontein, South Africa
41
Heisenberg Fellow (DFG), ITA Universität Heidelberg, 69117 Heidelberg, Germany
42
GRAPPA, Institute of High-Energy Physics, University of Amsterdam, Science Park 904, 1098 XH Amsterdam, The Netherlands
★ Corresponding author: H.E.S.S. Collaboration,
e-mail: This email address is being protected from spambots. You need JavaScript enabled to view it.
Received:
18
May
2015
Accepted:
9
November
2015
Abstract
Aim. We aim for an understanding of the morphological and spectral properties of the supernova remnant RCW 86 and for insights into the production mechanism leading to the RCW 86 very high-energy γ-ray emission.
Methods. We analyzed High Energy Spectroscopic System (H.E.S.S.) data that had increased sensitivity compared to the observations presented in the RCW 86 H.E.S.S. discovery publication. Studies of the morphological correlation between the 0.5–1 keV X-ray band, the 2–5 keV X-ray band, radio, and γ-ray emissions have been performed as well as broadband modeling of the spectral energy distribution with two different emission models.
Results. We present the first conclusive evidence that the TeV γ-ray emission region is shell-like based on our morphological studies. The comparison with 2–5 keV X-ray data reveals a correlation with the 0.4–50 TeV γ-ray emission. The spectrum of RCW 86 is best described by a power law with an exponential cutoff at Ecut = (3.5 ± 1.2stat) TeV and a spectral index of Γ ≈ 1.6 ± 0.2. A static leptonic one-zone model adequately describes the measured spectral energy distribution of RCW 86, with the resultant total kinetic energy of the electrons above 1 GeV being equivalent to ~0.1% of the initial kinetic energy of a Type Ia supernova explosion (1051 erg). When using a hadronic model, a magnetic field of B ≈ 100 μG is needed to represent the measured data. Although this is comparable to formerly published estimates, a standard E−2 spectrum for the proton distribution cannot describe the γ-ray data. Instead, a spectral index of Γp ≈ 1.7 would be required, which implies that ∼7 × 1049/ncm−3 has been transferred into high-energy protons with the effective density ncm−3 = n/1 cm−3. This is about 10% of the kinetic energy of a typical Type Ia supernova under the assumption of a density of 1 cm−3.
Key words: astroparticle physics / gamma rays: general / ISM: supernova remnants / cosmic rays
© ESO 2018
1 Introduction
Supernova remnants (SNR) are prime candidates to be sources of Galactic cosmic rays. The detection of very-high-energy (VHE) γ-ray (E > 100 GeV) and nonthermal X-ray emission from SNRs has shown that they do in fact accelerate particles to energies above 100 TeV (see, e.g., Hinton & Hofmann 2009; Aharonian 2013).
RCW 86 (also known as G315.4-2.3 or MSH 14-63) is located at a distance of (2.5 ± 0.5) kpc (Helder et al. 2013). It is almost circular in shape with a diameter of about 40’ clearly showing a shell-like structure in the optical (Smith 1997), radio (Kesteven & Caswell 1987), infrared (Williams et al. 2011) and X-ray (Pisarski et al. 1984) regimes. The source has been detected in γ-rays (Aharonian et al. 2009; Yuan et al. 2014), but a shell-like structure was not resolved. RCW 86 is a young SNR, which is about 1800 years old, based on the probable connection to the historical supernova SN 185 recorded by Chinese astronomers in 185 AD (Stephenson & Green 2002; Smith 1997; Dickel et al. 2001; Vink et al. 2006). The nature of the RCW 86 supernova (SN) progenitor was under intense discussion in the context of its young age and its unusually large size with a radius of R ≈ 15d2.5 pc (d2.5: the distanceto RCW 86 in units of 2.5 kpc). Williams et al. (2011) comprehensively studied all arguments about the type of the progenitor of RCW 86 and conducted hydrodynamic simulations to explain the observed characteristics. They concluded that RCW 86 is likely the remnant of a Type Ia supernova. The explosion was off-center in a low-density cavity carved by the progenitor system (see also Vink et al. 1997; Broersen et al. 2014).
The physical conditions vary within the volume of RCW 86. While slow shocks have been measured ( ~600–800 km s−1; Long & Blair 1990; Ghavamian et al. 2001) in the southwest (SW) and northwest (NW) regions along with relatively high post-shock gas densities ( ~2 cm−3; Williams et al. 2011), X-ray measurements by Helder et al. (2009) indicate high velocities of 6000 ± 2800 km s−1 in the northeast (NE) whereas optical measurements of specific knots in this region by Helder et al. (2013) show large variations in proper motions between 700–2000 km s−1 and low densities of ~0.1–0.3 cm−3 (see Yamaguchi et al. 2011). In the SW, NE, and to a lesser extent in the NW region, nonthermal X-ray emission is detected (Bamba et al. 2000; Vink et al. 1997, 2006; Williams et al. 2011). Near a region of Fe-K-line emission in the SW, there is nonthermal emission possibly synchrotron radiation from electrons accelerated at the reverse shock (Rho et al. 2002).
Here, we present a new analysis of VHE γ-ray data of RCW 86 taken with the High Energy Stereoscopic System (H.E.S.S.). When the discovery of RCW 86 was published by the H.E.S.S. Collaboration, the morphology in the TeV γ-ray regime could not be resolved owing to limited statistics (Aharonian et al. 2009). The new analysis benefits from significantly improved statistics and addresses whether RCW 86 has a shell structure in the VHE γ-ray regime. In addition, the larger data set allows for a broadband modeling of the spectral energy distribution with both a leptonic and an hadronic one-zone model. We restricted ourselves to two simple models since it is unreasonable to use more intricate models with additional parameters that cannot be determined owing to limited statistics.
2 H.E.S.S. observations and analysis method
The H.E.S.S. is located in the Khomas Highland of Namibia at a height of about 1800 m above sea level. In its first phase, the system consisted of four identical imaging Cherenkov telescopes, each with a mirror area of 107 m2 and a large field of view of 5° (Bernlöhr et al. 2003). The data presented in this paper were taken during this phase.
In 2009 the H.E.S.S. Collaboration announced the discovery of RCW 86 in the VHE regime (Aharonian et al. 2009). The source morphology of RCW 86 was thoroughly studied, but the existing data did not suffice to settle the question of whether the VHE emission originates from a shell or from a spherical region. Between 2007 and 2011, observations of the neighboring source H.E.S.S. J1458−608 (de Los Reyes Lopez 2011) and the scan of the Galactic plane have added additional observation time to the data set, which now amounts to ~57 h. The zenith angles of these observations range from 36° to 53° and have a mean value of 40°. The data were recorded with pointing offsets between 0.5° and 2.5°, average 1.1°, from the RCW 86 position. The sensitivity and angular resolution were improved compared to the former publication (Aharonian et al. 2009), using an advanced analysis method (for further detail, see de Naurois & Rolland 2009) instead of the formerly used standard Hillas-parameter-based analysis. Standard cuts were used for spectral analysis and faint source cuts for morphological analysis. The faint source cuts have an improved angular resolution at the expense of lower statistics and a higher energy threshold of about 100 GeV (for the cut definition, see de Naurois & Rolland 2009). The results we present are consistent with the results of a multivariate analysis technique (Ohm et al. 2009), using an independent calibration scheme.
3 Results
The γ-ray excess map, using the ring background subtraction technique (Berge et al. 2007), is shown in Fig. 1. The map was smoothed with a Gaussian filter to reduce the effect of statisticalfluctuations. The 68% containment radius of 0. ° 061 of the H.E.S.S. point spread function (PSF) was chosen as smoothing radius.
Since this is larger than the bin size (0. ° 02), the pixels are correlated with each other. This is accounted for in the spatial-fitting process that we present. Extended γ-ray emission was found. We detected 1220 ± 87 excess γ-rays within a circular region centered at αJ2000 = 14h43m2.16s, δJ2000 = −62°26′56′′ with a radius of 0. °41 (see Fig. 1) and a source detection at a statistical significance of 18.3σ. The center is given by the flux averaged centroid, which was determined with the spectral results of the previous H.E.S.S. publication of RCW 86 (Aharonian et al. 2009). The radius was adjusted to the improved analysis method and better angular resolution.
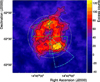 |
Fig. 1 VHE γ-ray emission of RCW 86. The sky map is extracted with faint analysis cuts and smoothed with a Gaussian filter with σsmooth = 0. ° 06 to reduce the effect of statistical fluctuations. Black contours correspond to 3, 5, 7σ significance. The white dotted circle depicts the integration region chosen for the spectral analysis. The dashed cyan sector shows the position angle range of the radial profile in Fig. 3. The two green sectors (solid lines) give the extraction regions for spectra of the SW and NE regions discussed in Sect. 3. |
3.1 Spectral analysis
A fit of a power-law function  to the spectral data analyzed with the standard analysis cuts yields Γ = 2.3 ± 0.1stat ± 0.2sys, and the differential flux normalization at 1 TeV of Φ0 = (2.9 ± 0.2stat ± 0.6sys) × 10−12 cm−2 s−1 TeV−1 (Log(likelihood) = −54; see Fig. 2). We tested if a power law with an exponential cutoff
  describes the data better than a simple power law. The fit gave Φ(1 TeV) = (3.0 ± 0.2stat ± 0.6sys) × 10−12 cm−2 s−1 TeV−1 with Γ = 1.6 ± 0.2stat ± 0.2sys and a cutoff energy Ecut = (3.5 ± 1.2stat ± 2.2sys) TeV (Log(likelihood) = −47.7), which is favored over the simple power law with a significance of 3.5σ, according to a log-likelihood ratio test. The spectral result of the power-law fit is compatible with a previous H.E.S.S. publication (Aharonian et al. 2009).
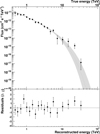 |
Fig. 2 Upper panel: differential energy spectrum of RCW 86 with the best-fit exponential cutoff power-law model. The error bars denote 1σ statistical errors. The shaded area represents the 1σ confidence level of the fitted spectrum. Bottom panel: corresponding residuals. |
3.2 Morphology
To settle the question of whether the TeV γ-ray emission is shell-like as found in the optical, radio, and X-ray bands, a two-dimensional log-likelihood fit was applied to the uncorrelated sky maps taking the morphological model and instrument response into account. To distinguish between different morphological structures, we used two alternative models: a sphere and a shell model. The models are obtained by line-of-sight integrals of a three-dimensional emitting sphere or shell. In the case of the shell model, the free parameters are the center position and the inner and outer radius. The sphere model is derived from the shell model by fixing the inner radius to zero. Both models have uniform emissivity. Table 1 summarizes the fit results. The shell structure is favored over the sphere structure with a significance of about 8σ. In Fig. 3 (left panel), the radial profile of the TeV emission itself is given together with the fit results of both models.
To facilitate the comparison, radial excess profiles of VHE γ-ray, X-ray, and radio emission are presented in the center and right panels of Fig. 3. The X-ray data is split into two energy bands: 0.5–1 keV and 2–5 keV. The latter exhibits a higher amount of nonthermal emission in comparison to the low-energy band. The nonthermal emission in RCW 86 is not evenly distributed. Broersen et al. (2014) have shown that the NE region is dominated by nonthermal emission, while the SW region exhibits similar amounts of hot thermal and nonthermal emission. In the NW and SE regions, however, thermal emission prevails. In Fig. 3, the central panel depicts the radial profile of the whole SNR, whereas in the right panel only the data of the SW region within the position angle range1 of 190° to 230° were used to determine the profiles. The radio data are from Molonglo Observatory Synthesis Telescope (MOST; Whiteoak & Green 1996) and the X-ray data are taken with the XMM-Newton X-ray telescope (Broersen et al. 2014). The radial profile of the whole remnant (Fig. 3, center panel) clearly shows that the TeV and the X-ray emission of the energy range between 2–5 keV are correlated, whereas in the case of low energetic X-ray emission (0.5–1 keV) and radio emission a weaker luminosity is found in the central region and the shell-like emission is more pronounced.The radial profiles of the SW region of TeV γ-ray emission, low- and high-energy X-ray radiation (Fig. 3, right panel) again seem to reveal a correlation between the 2–5 keV X-ray emission and the TeV-emission. In addition, it seems that the maximum of the 2–5 keV X-ray emission is slightly more off-center than the maximum of the TeV emission, but this is not significant because of the low statistics of the TeV data. The maxima of the low-energy X-ray (0.5–1 keV) and radio emission are at larger radii. In summary, the TeV emission and the high-energy X-ray emission (2–5 keV) are correlated throughout the remnant, whereas radio and low-energy X-ray emission regions are further away from the center and show lower levels of emission in the central region of the remnant.
To study the influence of the different physical conditions like shock speeds and densities on the γ-ray emission, spectra of two different subregions (SW and NE) were extracted. Figure 1 shows the regions, their position, and their size. They are both centered around the best-fit position of the 3D-shell model. A Gaussian function was fitted to the radial profile of the γ-ray data and the 1σ interval around the mean of the fit was then taken as the minimal and maximal radii of the regions. In both regions, a detection significance of about 10σ has been achieved. The resulting spectrum is well described by a power-law model, which was fitted to the data up to an energy of 20 TeV. It is not possible to distinguish between a simple power-law spectrum and one with an exponential cutoff because of the lower statistics of the quadrant data. We obtained spectral indices of Γ = (2.5 ± 0.2stat ± 0.2sys) and of Γ = (2.2 ± 0.1stat ± 0.2sys) as well as a differential flux normalization at 1 TeV of Φ0 = (0.7 ± 0.1stat ± 0.1sys) × 10−12 cm−2 s−1 TeV−1 and Φ0 = (0.7 ± 0.1stat ± 0.1sys) × 10−12 cm−2 s−1 TeV−1 in the NE and SW regions, respectively. Thus, there is no significant spectral difference between both regions. The results are consistent with the spectrum of the whole remnant.
Results of the two-dimensional log-likelihood fit of morphological models to the H.E.S.S. data.
 |
Fig. 3 Radial profiles: the shell model’s best-fit center point position (see Table 1) serves as a common center for the radial profiles of the γ-ray, X-ray, and radio data. Left panel: radial profile of the spatial distribution of the TeV γ-ray emission isshown as black crosses, which depict the measured TeV data points and their errors. The dashed red line corresponds to the radial profile of the sphere morphology and the green line to the shell model. Center and right panels: radial profiles in the TeV γ-ray, radio, 0.5–1 keV, and 2–5 keV X-ray regimes for different regions of RCW 86 are shown. While the center panel covers the entire position angle range, the right panel only shows the SW region with position angles between 190° and 230° (position angle 0° corresponds to north and 90° to east; see Fig. 1). Black crosses are measured VHE excess points. The low-energy (0.5–1 keV, dashed cyan line) and high-energy (2–5 keV, dotted brown line)X-ray band data and the radio data (solid magenta line) were smoothed with the H.E.S.S.-PSF to accountfor the different angular resolution of the different instruments. The radio data are from Molonglo Observatory Synthesis Telescope (MOST; see Whiteoak & Green 1996) and the X-ray data are from the XMM-Newton X-ray telescope (Broersen et al. 2014). The γ-ray and X-ray data are normalized so that the area underneath the curve is equal to one; the radio data are scaled such that the area underneath the data points is equal to 0.5. |
4 Discussion
SNRs are thought to be the primary sources for the bulk of Galactic cosmic-ray protons with energies up to ~ 3 PeV, but the final proof is still lacking. The broadband, nonthermal emission of these sources is produced by accelerated particles through several channels, e.g., synchrotron, inverse Compton, nonthermal Bremsstrahlung, and neutral pion decay. To achieve insights into the γ-ray production taking place in SNRs, the different processes have to be disentangled and analyzed. We present the results of the broadband data of RCW 86 in two different scenarios for radiation mechanism for the γ-ray emission: inverse Compton (IC) scattering of electrons off ambient photons (leptonic scenario) or proton-proton interaction with the ambient medium (hadronic scenario). For both cases, we have modeled the broadband emission of RCW 86 with a simple static one-zone model (presented in Acero et al. 2010), where the radiation of the different wavebands is produced within the same region with a constant magnetic field. The current energy distributions of the particles (electrons and/or protons) are given by a power law with an exponential cutoff. Synchrotron radiation and IC scattering on the cosmic microwave background and the local interstellar (optical and infrared) radiation fields (see Porter & Strong 2005) were taken into account with energy densities of 0.66 eV cm−3 (dust) and 0.94 eV cm−3 (stars). In the case of the hadronic scenario, the γ-ray production was calculated following Kelner et al. (2006). Nonthermal Bremsstrahlung is neglected because of the low ambient density ≤1 cm−3. The modeling was done under the assumption that the distance of RCW 86 is 2500 pc, the outer radius is 15 pc, and the shell thickness is 5 pc. The emission at all wavelengths was calculated for the shell region. The stationary one-zone model is however an oversimplification because the radio morphology and the nonthermal X-ray morphology differ, which cannot be explained by this kind of model. The spectral energy distribution presented in Fig. 4 is composed of the VHE γ-ray spectra presented in Sect. 3, the Fermi-LAT data points (Yuan et al. 2014), the X-ray spectra of ASCA and RXTE (Lemoine-Goumard et al. 2012), and the radio data from the Molonglo at 408 MHz and Parkes at 5 GHz (Caswell et al. 1975; Lemoine-Goumard et al. 2012).
In the leptonic case, the broadband data can be described by a one-zone model using an electron spectrum with a spectral index of Γe ≈ 2.3, an exponential cutoff at Ecut ≈ 19 TeV, and a magnetic field of B ≈ 22 μG (see Fig. 4). These results are comparable to those of Lemoine-Goumard et al. (2012) and Yuan et al. (2014) and the magnetic field is comparable to estimates by Vink et al. (2006). The total kinetic energy of all electrons above 1 GeV amounts to ~ 1048 erg, which is about 0.1% of the total energy of a typical Type Ia supernova (1051 erg). We obtain an upper limit for the energy injected into accelerated protons of  with the effective density
  also taking into account protons with the same spectral index as the electrons and a conservative chosen energy cutoff of 100 TeV. A higher amount of energy is not compatible with the Fermi-LAT upper limits (see Fig. 4). This energy limit implies an electron-to-proton ratio above 1 GeV of Kep ≥ 10−1. These results are in good agreement with those obtained by Lemoine-Goumard et al. (2012).
In the case of the hadronic scenario, the γ-rays are produced via proton-proton interactions and subsequent neutral pion decay whereas the X-rays are still produced via synchrotron radiation of high-energetic electrons. Therefore, the electron fraction has to be lower and the magnetic field stronger. A standard proton spectrum with Γp = 2 and a total energy in accelerated protons at emission time of  would describe the H.E.S.S. measurements, but is incompatible with the Fermi-LAT results (see Fig. 5 black dashed line). This was already pointed out by Lemoine-Goumard et al. (2012). The proton spectrum, which reproduces the γ-ray data, has a spectral index of Γp ≈ 1.7 and a cutoff energy of Ecut = 35 TeV. The index lies between the spectral index of the test particle approach and the spectral index with strong modified shocks (Malkov 1999; Berezhko & Ellison 1999). The blue line in Fig. 5 presents this hadronic model. The total energy of all protons above 1 GeV is
  erg, which means that a fraction of
  of the supernova (Type Ia) energy has to be converted into high-energy protons. The electron-to-proton ratio is Kep = 10−3. To model the radio and X-ray data, an electron spectrum with spectral index of Γe ≈ 2.3 and a cutoff energy of Ecut = 9 TeV is needed and a magnetic field strength of 100 μG. This is comparable to two different estimates: one by Völk et al. (2005) of
  G, which was deduced from the thickness of the filaments in the SW region, and another one calculated by Arbutina et al. (2012) of a volume-averaged magnetic field of ~70 μG. The total kinetic energy of the protons above 1 GeV was found to be
  erg, which means that about 10%
 of the supernova (Type Ia) energy has to be converted into high-energy protons.
As already mentioned, the hadronic model cannot reproduce the radio data with an electron spectrum that has the same spectral index as the proton spectrum (Γp= 1.7). This is in conflict with the expectation that electrons and protons exhibit the same dynamics at relativistic energies up to an energy where electron synchrotron losses become important.
Lemoine-Goumard et al. (2012) applied a two-zone model to the data to overcome this problem. They introduced a separate second leptonic population to explain the radio emission with the consequence that the lower limit on the magnetic field was 50 μG. The X-ray emission was reproduced with an injection spectrum with a power-law index of Γ = 1.8, a break at 3 TeV, caused by synchrotron cooling, and an exponential cut-off at 20 TeV. The energy injected into hadrons was  . These results fulfill the observational constraints, but the problem remains that the proton spectrum is particularly hard.
When we compare the modeling results of both the leptonic and hadronic models, we find that neither can be ruled out. The hadronic model encounters problems by describing the data in a self-consistent way, i.e., it is not possible to describe the radio data with electron and proton spectra with the same spectral index, which would be expected for relativistic particles under the assumption of diffuse shock acceleration theory. Better statistics and possibly more detailed models are needed to solve this question.
Our study of the morphological correlation between radio, X-rays, and γ-rays has shown (see Sect. 3) that radio and the X-ray emission in the energy range between 0.5 and 1 keV do not coincide with the γ-ray emission, while the emission in the X-ray regime 2–5 keV shows a correlation with the TeV γ-ray emission. This X-ray emission (2–5 keV) is spatially near to a Fe-K-line. Rho et al. (2002) argued that the hard X-ray continuum is synchrotron radiation produced by electrons, which are accelerated in the reverse shock. It is therefore possible that some of the VHE γ-ray emission comes from the region shocked by the reverse shock. A possible hint for this is provided by the more centrally filled morphology of the VHE γ-ray emission with respect to the radio emission, however, the sensitivity of the γ-ray is not sufficient to draw any firm conclusions about this.
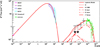 |
Fig. 4 Spectral energy distribution of RCW 86 for a leptonic scenario. The red solid lines denote the total broadband emission from the one-zone modeling discussed in Sect. 4. The dotted lines show the IC-contributions and the dashed line is that of the π0 -decay contribution. The radio data points are from Molonglo at 408 MHz and Parkes at 5 GHz (Caswell et al. 1975; Lemoine-Goumard et al. 2012). X-ray data are from ASCA and RXTE from Lemoine-Goumard et al. (2012). The Fermi-LAT data points are taken from Yuan et al. (2014) and the H.E.S.S. data are from this analysis. |
 |
Fig. 5 Spectral energy distribution of RCW 86 for a hadronic scenario. The solid blue lines denote the total broadband emission from the one-zone modeling discussed in Sect. 4 The dotted lines show the IC-contributions and the dashed line is that of the π0 -decay contribution. The black dashed dotted line shows the results for a proton spectrum with Γp = 2. The radio data points are from Molonglo at 408 MHz and Parkes at 5 GHz (Caswell et al. 1975; Lemoine-Goumard et al. 2012). X-ray data are from ASCA and RXTE from Lemoine-Goumard et al. (2012). The Fermi-LAT data points are taken from Yuan et al. (2014) and the H.E.S.S. data are from this analysis. |
5 Conclusion
In this work, we presented the first strong evidence that RCW 86 shows a shell-type morphology in TeV γ-rays. The TeV γ-ray spectrum favors an exponential cutoff power law with Γ = 1.59 ± 0.22stat ± 0.2sys and a cutoff energy Ecut = 3.47 ± 1.23stat ± 2.2sys TeV rather than a pure power law.
The broadband SED can be well described by a simple leptonic one-zone model with a magnetic field strength of B ≈ 22 μG and a Γ ≈ 2.3 power-law electron spectrum with an exponential cutoff at Ecut ≈ 19 TeV. The kinetic energy of all electrons above 1 GeV is about 0.1% of the kinetic energy of the supernova explosion of 1051 erg.
Modeling the broadband data using a hadronic one-zone model requires a hard proton spectrum with index Γp ≈ 1.7. This model is incompatible with a conventional ∝ E−2 acceleration spectrum, but lies between the spectral index value of the test particle approach and the one with strong modified shocks (Malkov 1999; Berezhko & Ellison 1999). The total energy of all protons above 1 GeV is  erg, when a distance of 2.5 kpc are assumed. As a result of limited statistics neither the leptonic nor the hadronic model can be ruled out.
Acknowledgments
The support of the Namibian authorities and of the University of Namibia in facilitating the construction and operation of H.E.S.S. is gratefully acknowledged, as is the support by the German Ministry for Education and Research (BMBF), the Max Planck Society, the German Research Foundation (DFG), the French Ministry for Research, the CNRS-IN2P3 and the Astroparticle Interdisciplinary Programme of the CNRS, the UK Science and Technology Facilities Council (STFC), the IPNP of the Charles University, the Czech Science Foundation, the Polish Ministry of Science and Higher Education, the South African Department of Science and Technology and National Research Foundation, and by the University of Namibia. We appreciate the excellent work of the technical support staff in Berlin, Durham, Hamburg, Heidelberg, Palaiseau, Paris, Saclay, and in Namibia in the construction and operation of the equipment. The MOST is operated by The University of Sydney with support from the Australian Research Council and the Science Foundation for Physics within The University of Sydney.
References
- Acero, F., Aharonian, F., Akhperjanian, A. G., et al. 2010, A&A, 516, A7 [Google Scholar]
- Aharonian, F. A. 2013, Astropart. Phys., 43, 71 [NASA ADS] [CrossRef] [Google Scholar]
- Aharonian, F., Akhperjanian, A. G., de Almeida, U. B., et al. 2009, ApJ, 692, 1500 [NASA ADS] [CrossRef] [Google Scholar]
- Arbutina, B., Urošević,, Andjelić, M. M., Pavlović, M. Z., & Vukotić, B. 2012, ApJ, 746, 79 [NASA ADS] [CrossRef] [Google Scholar]
- Bamba, A., Koyama, K., & Tomida, H. 2000, PASJ, 52, 1157 [NASA ADS] [Google Scholar]
- Berezhko, E. G., & Ellison, D. C. 1999, ApJ, 526, 385 [NASA ADS] [CrossRef] [Google Scholar]
- Berge, D., Funk, S., & Hinton, J. 2007, A&A, 466, 1219 [NASA ADS] [CrossRef] [EDP Sciences] [Google Scholar]
- Bernlöhr, K., Carrol, O., Cornils, R., et al. 2003, Astropart. Phys., 20, 111 [NASA ADS] [CrossRef] [Google Scholar]
- Broersen, S., Chiotellis, A., Vink, J., & Bamba, A. 2014, MNRAS, 441, 3040 [NASA ADS] [CrossRef] [Google Scholar]
- Caswell, J. L., Clark, D. H., & Crawford, D. F. 1975, Aust. J. Phys., 37, 39 [Google Scholar]
- de Los Reyes Lopez, R. 2011, in Proc. 32nd Int. Cosmic Ray Conf. (ICRC 2011), 216 [Google Scholar]
- de Naurois, M., & Rolland, L. 2009, Astropart. Phys., 32, 231 [NASA ADS] [CrossRef] [Google Scholar]
- Dickel, J. R., Strom, R. G., & Milne, D. K. 2001, ApJ, 546, 447 [NASA ADS] [CrossRef] [Google Scholar]
- Ghavamian, P., Raymond, J., Smith, R. C., & Hartigan, P. 2001, ApJ, 547, 995 [NASA ADS] [CrossRef] [Google Scholar]
- Helder, E. A., Vink, J., Bassa, C. G., et al. 2009, Science, 325, 719 [NASA ADS] [CrossRef] [PubMed] [Google Scholar]
- Helder, E. A., Vink, J., Bamba, A., et al. 2013, MNRAS, 435, 910 [NASA ADS] [CrossRef] [Google Scholar]
- Hinton, J. A., & Hofmann, W. 2009, ARA&A, 47, 523 [NASA ADS] [CrossRef] [Google Scholar]
- Kelner, S. R., Aharonian, F. A., & Bugayov, V. V. 2006, Phys. Rev. D, 74, 034018 [NASA ADS] [CrossRef] [Google Scholar]
- Kesteven, M. J., & Caswell, J. L. 1987, A&A, 183, 118 [NASA ADS] [Google Scholar]
- Lemoine-Goumard, M., Renaud, M., Vink, J., et al. 2012, A&A, 545, A28 [NASA ADS] [CrossRef] [EDP Sciences] [Google Scholar]
- Long, K. S., & Blair, W. P. 1990, ApJ, 358, L13 [NASA ADS] [CrossRef] [Google Scholar]
- Malkov, M. A. 1999, ApJ, 511, L53 [NASA ADS] [CrossRef] [Google Scholar]
- Ohm, S., van Eldik, C., & Egberts, K. 2009, Astropart. Phys., 31, 383 [NASA ADS] [CrossRef] [Google Scholar]
- Pisarski, R. L., Helfand, D. J., & Kahn, S. M. 1984, ApJ, 277, 710 [NASA ADS] [CrossRef] [Google Scholar]
- Porter, T. A., & Strong, A. W. 2005, Proc. 29th ICRC, 4, 77 [Google Scholar]
- Rho, J., Dyer, K. K., Borkowski, K. J., & Reynolds, S. P. 2002, ApJ, 581, 1116 [NASA ADS] [CrossRef] [Google Scholar]
- Smith, R. C. 1997, AJ, 114, 2664 [NASA ADS] [CrossRef] [Google Scholar]
- Stephenson, F. R., & Green, D. A. 2002, Historical supernovae and their remnants, Int. Ser. Astron. Astrophys., vol. 5 [Google Scholar]
- Vink, J., Kaastra, J. S., & Bleeker, J. A. M. 1997, A&A, 328, 628 [NASA ADS] [Google Scholar]
- Vink, J., Bleeker, J., van der Heyden, K., et al. 2006, ApJ, 648, L33 [NASA ADS] [CrossRef] [Google Scholar]
- Völk, H. J., Berezhko, E. G., & Ksenofontov, L. T. 2005, A&A, 433, 229 [NASA ADS] [CrossRef] [EDP Sciences] [Google Scholar]
- Whiteoak, J. B. Z., & Green, A. J. 1996, A&AS, 118, 329 [NASA ADS] [CrossRef] [EDP Sciences] [Google Scholar]
- Williams, B. J., Blair, W. P., Blondin, J. M., et al. 2011, ApJ, 741, 96 [NASA ADS] [CrossRef] [Google Scholar]
- Yamaguchi, H., Koyama, K., & Uchida, H. 2011, PASJ, 63, 837 [NASA ADS] [Google Scholar]
- Yuan, Q., Huang, X., Liu, S., & Zhang, B. 2014, ApJ, 785, L22 [NASA ADS] [CrossRef] [Google Scholar]
Position angle 0° corresponds to north and 90° to east.
All Tables
Results of the two-dimensional log-likelihood fit of morphological models to the H.E.S.S. data.
All Figures
|
Fig. 1 VHE γ-ray emission of RCW 86. The sky map is extracted with faint analysis cuts and smoothed with a Gaussian filter with σsmooth = 0. ° 06 to reduce the effect of statistical fluctuations. Black contours correspond to 3, 5, 7σ significance. The white dotted circle depicts the integration region chosen for the spectral analysis. The dashed cyan sector shows the position angle range of the radial profile in Fig. 3. The two green sectors (solid lines) give the extraction regions for spectra of the SW and NE regions discussed in Sect. 3. |
| In the text | |
|
Fig. 2 Upper panel: differential energy spectrum of RCW 86 with the best-fit exponential cutoff power-law model. The error bars denote 1σ statistical errors. The shaded area represents the 1σ confidence level of the fitted spectrum. Bottom panel: corresponding residuals. |
| In the text | |
|
Fig. 3 Radial profiles: the shell model’s best-fit center point position (see Table 1) serves as a common center for the radial profiles of the γ-ray, X-ray, and radio data. Left panel: radial profile of the spatial distribution of the TeV γ-ray emission isshown as black crosses, which depict the measured TeV data points and their errors. The dashed red line corresponds to the radial profile of the sphere morphology and the green line to the shell model. Center and right panels: radial profiles in the TeV γ-ray, radio, 0.5–1 keV, and 2–5 keV X-ray regimes for different regions of RCW 86 are shown. While the center panel covers the entire position angle range, the right panel only shows the SW region with position angles between 190° and 230° (position angle 0° corresponds to north and 90° to east; see Fig. 1). Black crosses are measured VHE excess points. The low-energy (0.5–1 keV, dashed cyan line) and high-energy (2–5 keV, dotted brown line)X-ray band data and the radio data (solid magenta line) were smoothed with the H.E.S.S.-PSF to accountfor the different angular resolution of the different instruments. The radio data are from Molonglo Observatory Synthesis Telescope (MOST; see Whiteoak & Green 1996) and the X-ray data are from the XMM-Newton X-ray telescope (Broersen et al. 2014). The γ-ray and X-ray data are normalized so that the area underneath the curve is equal to one; the radio data are scaled such that the area underneath the data points is equal to 0.5. |
| In the text | |
|
Fig. 4 Spectral energy distribution of RCW 86 for a leptonic scenario. The red solid lines denote the total broadband emission from the one-zone modeling discussed in Sect. 4. The dotted lines show the IC-contributions and the dashed line is that of the π0 -decay contribution. The radio data points are from Molonglo at 408 MHz and Parkes at 5 GHz (Caswell et al. 1975; Lemoine-Goumard et al. 2012). X-ray data are from ASCA and RXTE from Lemoine-Goumard et al. (2012). The Fermi-LAT data points are taken from Yuan et al. (2014) and the H.E.S.S. data are from this analysis. |
| In the text | |
|
Fig. 5 Spectral energy distribution of RCW 86 for a hadronic scenario. The solid blue lines denote the total broadband emission from the one-zone modeling discussed in Sect. 4 The dotted lines show the IC-contributions and the dashed line is that of the π0 -decay contribution. The black dashed dotted line shows the results for a proton spectrum with Γp = 2. The radio data points are from Molonglo at 408 MHz and Parkes at 5 GHz (Caswell et al. 1975; Lemoine-Goumard et al. 2012). X-ray data are from ASCA and RXTE from Lemoine-Goumard et al. (2012). The Fermi-LAT data points are taken from Yuan et al. (2014) and the H.E.S.S. data are from this analysis. |
| In the text | |
Current usage metrics show cumulative count of Article Views (full-text article views including HTML views, PDF and ePub downloads, according to the available data) and Abstracts Views on Vision4Press platform.
Data correspond to usage on the plateform after 2015. The current usage metrics is available 48-96 hours after online publication and is updated daily on week days.
Initial download of the metrics may take a while.