| Issue |
A&A
Volume 612, April 2018
|
|
|---|---|---|
| Article Number | C1 | |
| Number of page(s) | 2 | |
| Section | Cosmology (including clusters of galaxies) | |
| DOI | https://doi.org/10.1051/0004-6361/201322104e | |
| Published online | 01 May 2018 | |
Evidence of environmental dependencies of Type Ia supernovae from the Nearby Supernova Factory indicated by local Hα (Corrigendum)
1
Université de Lyon, Université de Lyon 1, CNRS/IN2P3, Institut de Physique Nucléaire de Lyon, 69622 Lyon, France
e-mail: This email address is being protected from spambots. You need JavaScript enabled to view it.
2
Physics Division, Lawrence Berkeley National Laboratory, 1 Cyclotron Road, Berkeley, CA 94720, USA
3
Laboratoire de Physique Nucléaire et des Hautes Énergies, Université Pierre et Marie Curie Paris 6, Université Paris Diderot Paris 7, CNRS-IN2P3, 4 place Jussieu, 75252 Paris Cedex 05, France
4
Department of Physics, Yale University, New Haven, CT 06520-8121, USA
5
Physikalisches Institut, Universität Bonn, Nußallee 12, 53115 Bonn, Germany
6
Research School of Astronomy and Astrophysics, The Australian National University, Mount Stromlo Observatory, Cotter Road, Weston Creek, ACT 2611, Australia
7
Department of Physics, University of California Berkeley, 366 LeConte Hall MC 7300, Berkeley, CA 94720-7300, USA
8
Space Sciences Laboratory, University of California Berkeley, 7 Gauss Way, Berkeley, CA 94720, USA
9
Computational Cosmology Center, Computational Research Division, Lawrence Berkeley National Laboratory, 1 Cyclotron Road MS 50B-4206, Berkeley, CA 94611, USA
10
Department of Astronomy, University of California Berkeley, B-20 Hearst Field Annex # 3411, Berkeley, CA 94720-34110, USA
11
Centre de Recherche Astronomique de Lyon, Université Lyon 1, 9 avenue Charles André, 69561 Saint Genis Laval Cedex, France
12
Tsinghua Center for Astrophysics, Tsinghua University, Beijing 100084, PR China
13
Centre de Physique des Particules de Marseille, 163 avenue de Luminy, Case 902, 13288 Marseille Cedex 09, France
14
Center for Cosmology and Particle Physics, New York University, 4 Washington Place, New York, NY 10003, USA
Received:
12
December
2017
Accepted:
2
January
2018
Key words: cosmology: observations – errata, addenda
While undertaking the next phase of analysis of the correlation of Type Ia supernova (SN Ia) brightnesses with properties of their local host environments, we discovered a software error affecting the measurements used in Rigault et al. (2013). The measurements of host-galaxy Hα emission, ΣHα, and resulting local star formation rate, LSFR, measured for the environment surrounding each SN in Rigault et al. (2013) where not in units of M⊙ yr−1 kpc−2, as intended, but rather in units of M⊙ yr−1 arcsec−2 averaged over a 1 kpc aperture. Here we provide corrected values for several key quantities, finding that these do not significantly change the main conclusions of the original paper.
At our typical redshift of z ~ 0.05, the 1 kpc aperture used in Rigault et al. (2013) has a projected angular size of ~1 arcsec, so the overall scale of the measurements is unchanged. Measurements for SNe Ia spanning our lowest to highest redshift, i.e., 0.03 < z < 0.08, have scale ranges from 1.65 arcsec per kpc to 0.66 arcsec per kpc, changing ΣHα by at most ± 0.4 dex at the redshift extremes and producing an RMS change of 0.2 dex. This is to be compared to the nearly 3 dex range spanned by ΣHα.
In Rigault et al. (2013) the sample was divided evenly between SNe Ia in local environments above (Iaα) or below (Iaϵ) log(ΣHα) = 38.35 dex. There we further identified two grouping of SNe Ia: M1 were those fainter than average and having ΣHα values spanning the full observed range, while M2 were those brighter and having ΣHα values below our ΣHα threshold. With the corrections here, this boundary shifts by − 0.03 dex, to log(ΣHα) = 38.32 dex.
While the boundary barely moves, some SNe Ia cross the boundary. In particular, two overly bright SNe Ia formerly assigned to the Iaϵ group move into the Ia α group. These SNe Ia were part of a group of three cases discussed in Sect. 7.3 of Rigault et al. (2013), where we explored the impact of moving the ΣHα threshold and the potential impact of misassociations for Iaϵ with the Ia α group due to boosting by the warm interstellar medium (WIM) or accidental projection onto H II regions. One of these is just below our original inclination cut, reinforcing projection as an issue for this case. We originally decided that these SNe Ia belong to the M2 group and they lie more than 4 σ from the M1 group, so we retain them in the M2 group even though their corrected ΣHα values are now slightly higher.
Figure 1 shows the distribution of Hubble residuals with the corrected ΣHα values, to be compared with the topand bottom panels of Fig. 6 in the original paper. The two SNe Ia mentioned above are highlighted using a lighter shading to fill their markers. It is apparent that the bimodality originally discovered in Rigault et al. (2013) is still present. The dispersion of the Iaα group remains tight, 0.114± 0.013 mag, after rejecting the (now 3) bright SNe Iaα, and the dispersion of the Ia ϵ group remains larger, at 0.143± 0.016 mag. The difference in standardized magnitudes now has a step of 0.063 ± 0.029 mag between SNe Ia in the Iaα and Iaϵ groups, within the error bar of the original 0.094 ± 0.031 mag. The offset between the means of the M1 and M2 samples is 0.260± 0.020 mag, compared to the original 0.262 ± 0.019 mag. As these values are essentially unchanged, our estimate for the evolution of the step in Hubble residuals with host galaxy mass and its implications for cosmology still hold. The correlations originally noted between ΣHα and the light curve stretch (x1) and color (c) are also unaffected.
Subsequent to the analysis in Rigault et al. (2013) we have developed a more refined metric describing the local environments of SNe Ia (Rigault et al. 2015). This metric, the local specific star formation rate (LsSFR), more accurately separatesthese environment into younger and older categories. When applying this new indicator to the Rigault et al. (2013) dataset (as corrected here) the offset in brightness between SNe Ia from low and high LsSFR environments is 0.110± 0.030 mag. For completeness, we also note that this error has no effect on the results of Rigault et al. (2015), which used GALEX data and separate computer code.
References
- Rigault, M., Copin, Y., Aldering, G., et al. 2013, A&A, 560, A66 [NASA ADS] [CrossRef] [EDP Sciences] [Google Scholar]
- Rigault, M., Aldering, G., Kowalski, M., et al. 2015, ApJ, 802, 20 [NASA ADS] [CrossRef] [Google Scholar]
© ESO 2018
All Figures
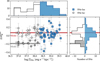 |
Fig. 1 Hubble residuals versus the now-corrected ΣHα within 1 kpc surrounding each SN Ia. Squares represent Iaα SNe Ia, while circles represent those categorized as Iaϵ. Among the Iaϵ, those with lighter gray belong to M1, while those with darker gray are in M2. The two SNe Ia that are overly bright and that have now moved above the SFR threshold (vertical dashed line) are shaded light blue. The original means of the M1 and M2 subsamples are shown as horizontal lines, and labeled accordingly. It can be seen that the two modes have moved slightly closer together. The upper panel shows the ΣHα histograms for the corrected (solid line) and the original (dashed line) values. |
| In the text | |
Current usage metrics show cumulative count of Article Views (full-text article views including HTML views, PDF and ePub downloads, according to the available data) and Abstracts Views on Vision4Press platform.
Data correspond to usage on the plateform after 2015. The current usage metrics is available 48-96 hours after online publication and is updated daily on week days.
Initial download of the metrics may take a while.