Fig. 1
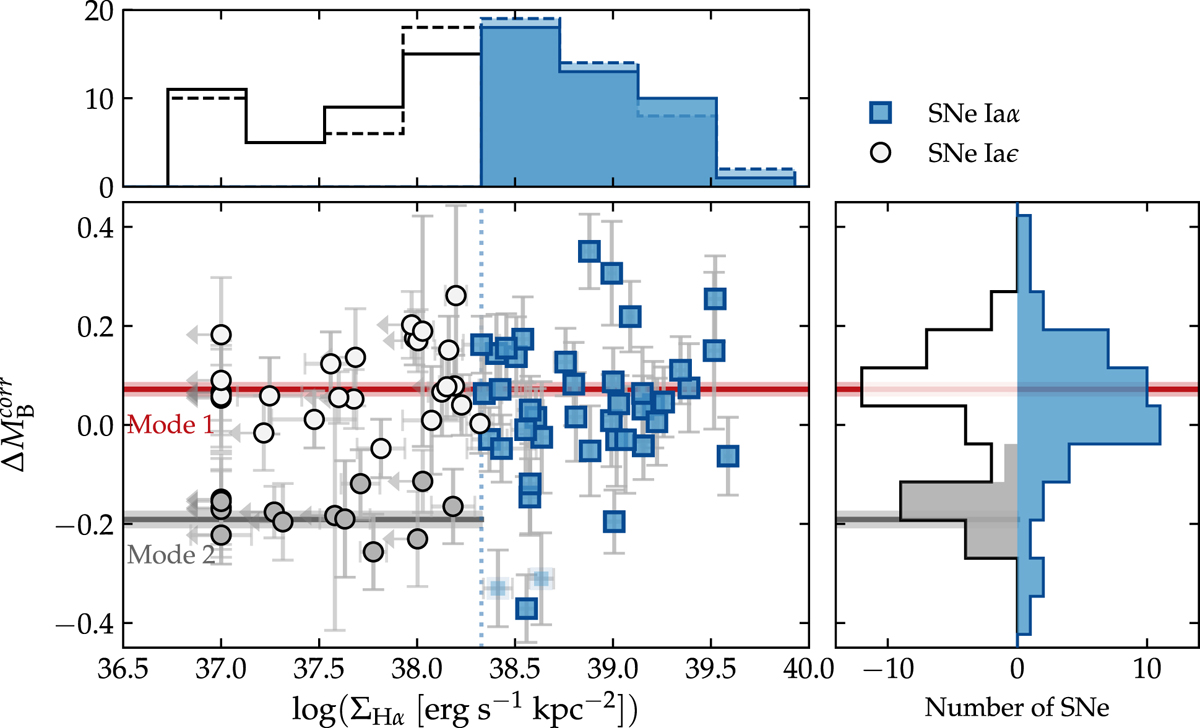
Hubble residuals versus the now-corrected ΣHα within 1 kpc surrounding each SN Ia. Squares represent Iaα SNe Ia, while circles represent those categorized as Iaϵ. Among the Iaϵ, those with lighter gray belong to M1, while those with darker gray are in M2. The two SNe Ia that are overly bright and that have now moved above the SFR threshold (vertical dashed line) are shaded light blue. The original means of the M1 and M2 subsamples are shown as horizontal lines, and labeled accordingly. It can be seen that the two modes have moved slightly closer together. The upper panel shows the ΣHα histograms for the corrected (solid line) and the original (dashed line) values.
Current usage metrics show cumulative count of Article Views (full-text article views including HTML views, PDF and ePub downloads, according to the available data) and Abstracts Views on Vision4Press platform.
Data correspond to usage on the plateform after 2015. The current usage metrics is available 48-96 hours after online publication and is updated daily on week days.
Initial download of the metrics may take a while.