Fig. 3
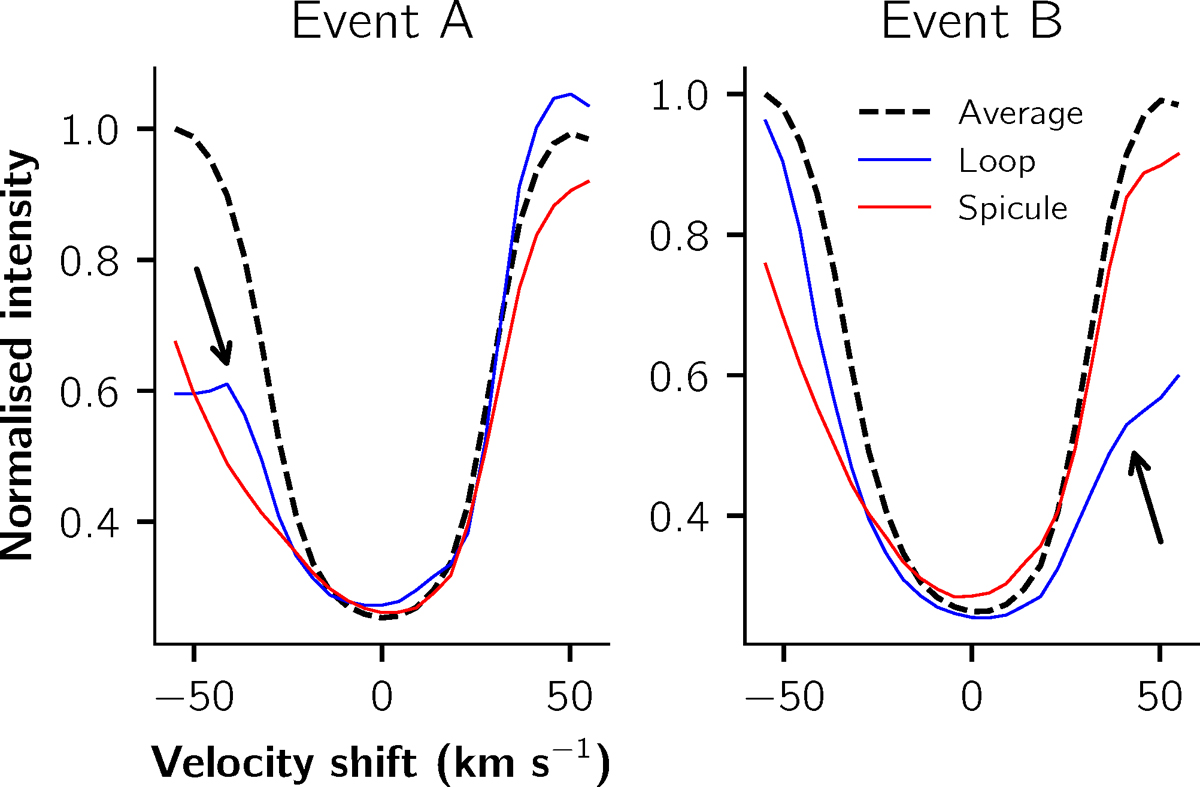
Hα spectra of low-lying loops and spicules. Taken from events A and B from Fig. 1, compared with the mean spectrum averaged over the field of view of the panels in Fig. 1 and the whole time sequence (black dashed line). The spectra of the low-lying loops (blue lines) and spicules (red lines) were observed at the locations of the red crosses and plus signs, respectively. Arrows indicate knees in the profiles.
Current usage metrics show cumulative count of Article Views (full-text article views including HTML views, PDF and ePub downloads, according to the available data) and Abstracts Views on Vision4Press platform.
Data correspond to usage on the plateform after 2015. The current usage metrics is available 48-96 hours after online publication and is updated daily on week days.
Initial download of the metrics may take a while.