Fig. 2
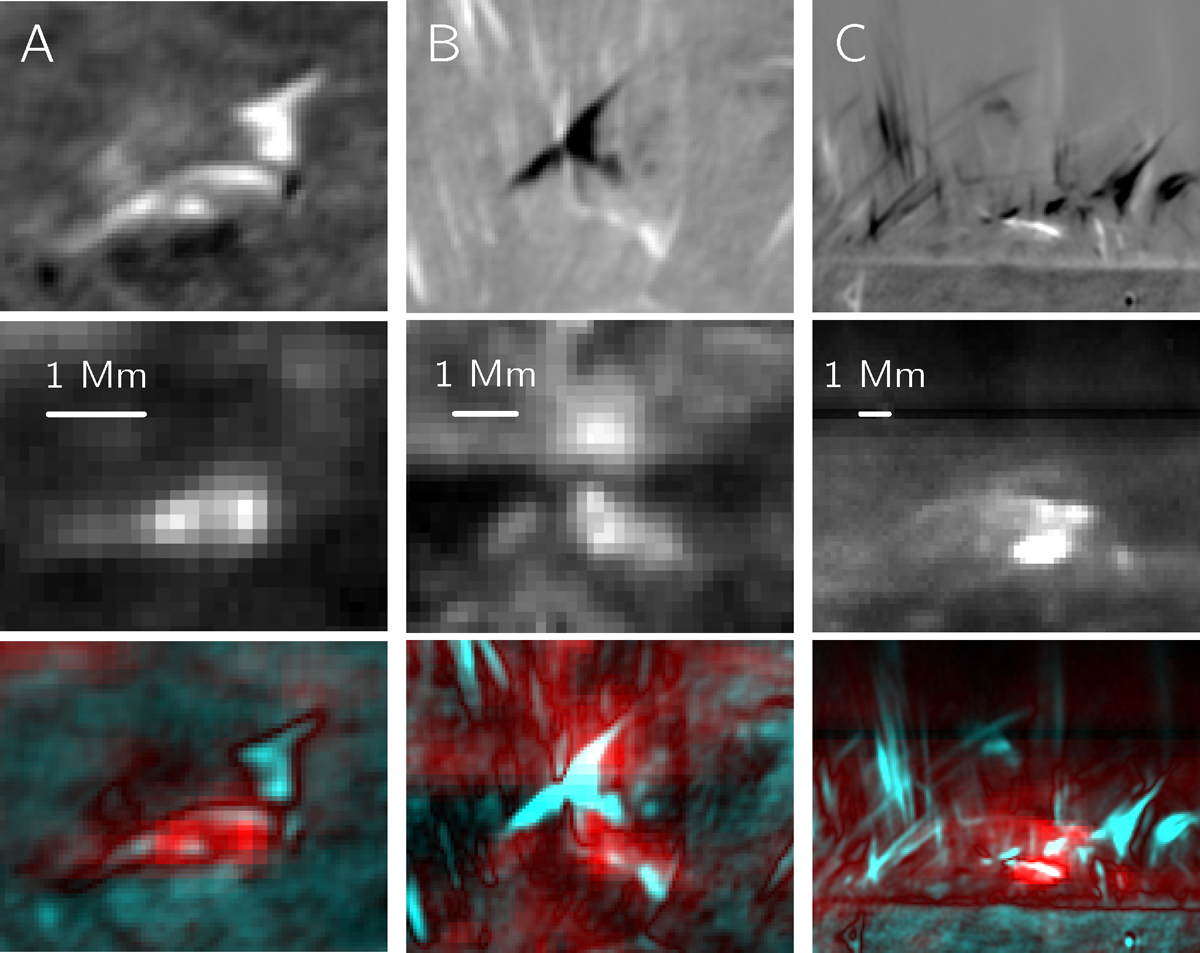
Hα inverse Y-shapes and associated SJI 1400 loops for three events (A, B, C). As in Fig. 1, the different rows show Hα± 55 km s−1 Dopplergrams (top), IRIS SJI 1400 (middle), and a combined image (bottom, red for SJI 1400 and cyan for the absolute value of the Hα Dopplergrams). Each panel has been individually scaled for the best contrast.
Current usage metrics show cumulative count of Article Views (full-text article views including HTML views, PDF and ePub downloads, according to the available data) and Abstracts Views on Vision4Press platform.
Data correspond to usage on the plateform after 2015. The current usage metrics is available 48-96 hours after online publication and is updated daily on week days.
Initial download of the metrics may take a while.