| Issue |
A&A
Volume 611, March 2018
|
|
|---|---|---|
| Article Number | L3 | |
| Number of page(s) | 5 | |
| Section | Letters to the Editor | |
| DOI | https://doi.org/10.1051/0004-6361/201832746 | |
| Published online | 19 March 2018 | |
Letter to the Editor
Subsonic islands within a high-mass star-forming infrared dark cloud
1
Max Planck Institute for Extraterrestrial Physics,
Gießenbachstraßse 1,
85748
Garching bei München, Germany
e-mail: This email address is being protected from spambots. You need JavaScript enabled to view it.
2
European Southern Observatory,
Karl-Schwarzschild-Str. 2,
85748
Garching bei München, Germany
3
Max Planck Institute for Astronomy,
Königstuhl 17,
69117
Heidelberg, Germany
4
Astrophysics Research Institute, Liverpool John Moores University,
146 Brownlow Hill,
Liverpool
L3 5RF, UK
5
Department of Astronomy, University of Florida,
Gainesville,
FL 32611, USA
6
Department of Physics, University of Florida,
Gainesville,
FL 32611, USA
7
INAF-Osservatorio Astrofisico di Arcetri,
Largo E. Fermi 5,
50125 Firenze,
Italy UK
8
School of Physics and Astronomy, Queen Mary University of London,
Mile End Road,
London
E1 4NS, UK
9
Harvard-Smithsonian Center for Astrophysics,
60 Garden Street,
Cambridge,
MA 02138, USA
Received:
1
February
2018
Accepted:
19
February
2018
Abstract
High-mass star forming regions are typically thought to be dominated by supersonic motions. We present combined Very Large Array and Green Bank Telescope (VLA+GBT) observations of NH3 (1,1) and (2,2) in the infrared dark cloud (IRDC) G035.39-00.33, tracing cold and dense gas down to scales of 0.07 pc. We find that, in contrast to previous, similar studies of IRDCs, more than a third of the fitted ammonia spectra show subsonic non-thermal motions (mean line width of 0.71 km s−1), and sonic Mach number distribution peaks around ℳ = 1. As possible observational and instrumental biases would only broaden the line profiles, our results provide strong upper limits to the actual value of ℳ, further strengthening our findings of narrow line widths. This finding calls for a re-evaluation of the role of turbulent dissipation and subsonic regions in massive-star and cluster formation. Based on our findings in G035.39, we further speculate that the coarser spectral resolution used in the previous VLA NH3 studies may have inhibited the detection of subsonic turbulence in IRDCs. The reduced turbulent support suggests that dynamically important magnetic fields of the 1 mG order would be required to support against possible gravitational collapse. Our results offer valuable input into the theories and simulations that aim to recreate the initial conditions of high-mass star and cluster formation.
Key words: ISM: kinematics and dynamics / ISM: clouds / stars: formation / ISM: individual objects: G035.39-00.33
© ESO 2018
1 Introduction
Supersonic turbulence has been found to dominate molecular cloud kinematics in star forming regions (Larson 1981). Towards the densest cores within these regions, however, the turbulence dissipates, allowing for the formation of stars (Benson & Myers 1989; Foster et al. 2009). Observationally,this decay of turbulence has been found to manifest itself as a difference in line widths between the lower-density gas, where the turbulence is scale-dependent, and the higher-density gas tracers, sensitive to the star-forming cores with typical sizes of 0.1 pc (Goodman et al. 1998; Caselli et al. 2002). This change in gas kinematics, or transition to coherence, has been observationally identified to be a sharp boundary between subsonic and transonic motion regimes in the Perseus B5 region (Pineda et al. 2010).
While a number of studies have focused on identifying the subsonic motions in low-mass star-forming cores, massive star formation is typically thought to be accompanied by large non-thermal gas motions, as it usually proceeds in highly dynamical environments where the protostars, having shorter dynamical timescales, rapidly accrete material from their surroundings (e.g. Tan et al. 2014). Indeed, recent observations point to the existence of large, pc-scale gas flows towards the star-forming cores (Peretto et al. 2013; Liu et al. 2012a,b; Sánchez-Monge et al. 2013; Henshaw et al. 2014; Liu et al. 2015; Wyrowski et al. 2016). Moreover, non-thermal motions are an important element in the turbulent core model for massive star formation (McKee & Tan 2003), where turbulent motions provide extra support against the gravitational collapse, allowing for greater accretion rates and, ultimately, for a higher stellar mass.
A massive filamentary infrared dark cloud (IRDC) G035.39-00.33 (G035.39 henceforth) at a distance of 2.9 kpc (Simon et al. 2006) has been extensively studied in the past with a variety of continuum and molecular tracers. The non-thermal velocity dispersions inferred in G035.39 from the single-dish CO observations have been found to be two to three times higher than the sound speed in the medium (Jiménez-Serra et al. 2014), and Henshaw et al. (2014) identified the filaments within the IRDC to be only mildly supersonic (ℳ ~ 1.4–1.6) with the 4′′ Plateau de Bure Interferometer (PdBI) N2H+ (1–0) observations. Furthermore, on large, parsec scales, the molecular gas that forms the IRDC is not affected by the feedback from embedded protostars: widespread CO depletion (Hernandez et al. 2011, 2012; Jiménez-Serra et al. 2014), as high deuterium fractionation levels (Barnes et al. 2016) and low gas kinetic temperatures (Sokolov et al. 2017) were found across the cloud. Despite the cloud’s starless appearance at parsec scales, some star formation in the cloud is already underway (Nguyen Luong et al. 2011 find a number of compact 70 μm sources in G035.39, some capable of forming intermediate- to high-mass stars).
By making use of the simultaneously derived temperature structure and the kinematics information obtained from the Very Large Array (VLA) on scales down to 0.07 pc, we are in a unique position to analyse dynamics of dense gas linking the cloud scales to those of the embedded protostars and protoclusters. In this Letter, we report the presence of widespread subsonic gas motions throughout G035.39.
2 Data reduction
The VLA observations were conducted on May 8, 2010 (project AW776; PI: Ke Wang), in two consecutive sessions, mapping the NH 3 (1,1) and (2,2) inversion transitions in the compact D-configuration as a five-point mosaic covering the entire IRDC. The separate sessions allowed the spectral setup to achieve the complete hyperfine structure coverage of the NH 3 transitions with a resolution of 15.625 kHz. The data were calibrated on the quasars J1851+005 (gain), J2253+1608 (bandpass), and 3C48 (flux) within the CASA data reduction package.
The calibrated visibilities were deconvolved with CASA task tclean using the multi-scale CLEAN algorithm (Cornwell 2008), with Briggs weighting and robust parameter set to 0.5. We taper the visibilities to achieve a similar synthesized beam between the two ammonia lines. To account for the missing flux, we fill in the zero spacing information from the ammonia data taken with the Green Bank Telescope (GBT). Detailed description of the GBT data reduction can be found in Sokolov et al. (2017). The GBT data were converted to spectral flux density units and smoothed to the VLA spectral resolution of 0.2 km s−1 with a Gaussian kernel. We then regrid both GBT (1,1) and (2,2) spectral cubes to the VLA spatial grid and apply the VLA mosaicprimary beam response to the GBT images. The VLA spectral cubes for both inversion lines are then deconvolvedagain with tclean, with the tclean mask being determined by combining the VLA only and GBT datasets using the feather task in CASA. By constructing the clean mask from independently feathered images, we ensure that unbiased knowledge of the extended emission is incorporated into the tclean run. The resulting NH 3 (1,1) and (2,2) spectral cubes, gridded into 1′′ pixels, have a common restoring beam of 5.44′′ . The typical rms value of the emission free spectra in the resultant cubes is 14 mJy/beam for NH3 (1,1) and 5 mJy/beam for NH3 (2,2) inversion lines in a 0.2 km s−1 channel.
3 Results
Figure 1 presents the integrated intensities of the NH 3 (1,1) and (2,2) lines overlaid with the mid-infrared extinction contours (Kainulainen & Tan 2013). The good correspondence between thetwo morphologies indicates that the dense gas, forming the bulk of the IRDC, is well traced with our combined ammonia observations. In addition, both inversion transitions have similar dynamic range (cf. 3σI detection contours in Fig. 1), allowing us to reliably constrain the gas temperature that depends on the ratio of the two metastable inversion level populations (Ho & Townes 1983).
The two ammonia spectral cubes were simultaneously forward-fitted pixel by pixel with the ammonia spectral profile model using the pyspeckit (Ginsburg & Mirocha 2011) Python package and the NH3 formalism described in Friesen et al. (2017). This produced a set of one-, two- and three-component fits to each position1 , where every fit has optimised values of the excitation temperature, kinetic gas temperature, total ammonia column density, velocity dispersion, and the velocity centroid of the line. Subsequently we make a heuristical decision on the number of velocity components in each spectrum (Fig. 2 shows selected spectra) by using the same approach as in Sokolov et al. (2017), namely, by restricting the minimal velocity separation between the components (components’ FWHM are not allowed to overlap), and imposing a minimal peak signal to noise ratio (S∕N > 3) for each component.
In orderto quantify the degree of non-thermal motions in the cloud, we calculate the non-thermal line widths by subtracting in quadrature both the thermal line widths and the channel width from the observed line widths. The thermal line widths are determined for each component using the fitted kinetic temperatures, which have a mean of 12.0 K and a standard deviation of 2.2 K across the entire map. We then derive the ratio of the non-thermal velocity dispersion component to the sound speed in the medium, ℳ ≡ σnt/cs for all the fitted components. We propagate the uncertainties on the gas kinetic temperature and the line widths into the Mach number uncertainties. The 25th, 50th, and 75th percentiles for the uncertainty distributions are σTd = 1.7, 2.5, and3.0 K, respectively, for the gas temperatures, and σ = 0.079, 0.120, and 0.192, respectively, for the Mach number errors.
We present the spatial distribution of the Mach number, ℳ, in Fig. 2. In case of more than one velocity component determined along the line of sight (~ 7%), the one with the smallest ℳ is shown. While this choice was made for visual clarity, we emphasise that in all other analyses in this paper the full range of the ℳ values is used. The map shown in Fig. 2 reveals the presenceof multiple regions of subsonic motions in the G035.39, hereafter referred to as islands of coherence.
More than a third (38.8% of 7680) of all the spectral components have non-thermal gas motions in the subsonic regime (ℳ < 1), while 42.0% are mildly supersonic (1 < ℳ < 2). The remaining data, ~19.2% of positions, show the non-thermal gas motions higher than the sound speed (ℳ > 2). In addition to their spatially clumped appearance, the subsonic islands exhibit a higher degree of coherence. The standard deviation of the transonic and supersonic line width population is 0.15 and 0.40 km respectively, consistently higher than the 0.08 km computed on the subsonic lines of ammonia.
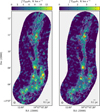 |
Fig. 1 Left to right: combined VLA+GBT integrated intensities of the observed ammonia (1,1) and (2,2) lines, computed between 42 and 47 km. The white dotted contour marks the significance level of the integrated intensity of each line at the 3σI level, where σI is the integrated intensity uncertainty (Mangum & Shirley 2015). The white solid contours show the infrared extinction contours (Kainulainen & Tan 2013) starting from AV = 30 mag and progressing inwards in steps of 30 mag. The open and filled red stars denote the positions of the Herschel sources from Nguyen Luong et al. (2011) below and above 20 M⊙, respectively, while the open diamonds mark the location of cores from (2009, 2012). |
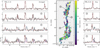 |
Fig. 2 A map of the non-thermal velocity dispersion to the gas sound speed in G035.39. In pixels where multiple velocity components are discovered, the smallest value is shown on the image (the analyses throughout the rest of this work use all the values). The markers are the same as in Fig. 1, and the solid white line contours indicate the transition at σnt ∕cs = 1. The side panels to the left and right of the map show (1,1) and (2,2) spectra towards the numbered positions. The spectra are overlaid with their best-fit model, with individual velocity components plotted in colour. The topmost spectra, unlike the others, show an averaged spectrum across the subsonic island at α(J2000) = 18h57m08s, δ(J2000) = +2∘09′45′′. An independently conducted fit, shown in red, yields ℳ = 0.72 ± 0.04. |
4 Discussion
Regions of massive star formation are generally thought to harbour internal motions larger than those of their lower-mass counterparts. To illustrate the difference between the previously found degrees of non-thermal motions and the ones found in G035.39, we plot the Gaussian kernel density estimate (KDE) of the sonic Mach number distribution for all the fitted ammonia components in Fig. 3. In a VLA survey of 15 IRDCs, Sánchez-Monge et al. (2013) find that in 79 cores of differing evolutionary stages, the earliest “starless core” class has typical line widths and temperatures of 1.0 km and 16 K. While these values are considerably lower than the corresponding ones for the protostellar stages studied (cf. Fig. 3 for the average values of σnt), they are still above the typical values found in G035.39 (Henshaw et al. 2014 find mean ℳ of 1.4–1.6 for the three filaments towards the northern part of the IRDC, and a fraction, 21%, of their spectra is subsonic). A similar VLA survey of IRDC kinematics by Ragan et al. (2012) found no values of ℳ below 2, favouring an even higher degree of non-thermal motions present inside the massive dense cores. Three other VLA surveys of ammonia (Lu et al. 2014; upper limit of 1.3 km on line widths in Bihr et al. 2015; typical ℳ from 3 to 5 reported in Dirienzo et al. 2015) report highly supersonic gas motions within IRDCs. We suggest that the coarser spectral resolution of the previous VLA ammonia studies in similar IRDCs might have inhibited the detection of the subsonic regime, as our spectral resolution of 0.2 km is higher than that of the previous studies (0.6 km in Ragan et al. 2012; Lu et al. 2014; Dirienzo et al. 2015; 0.6 km for most of the data used by Sánchez-Monge et al. 2013; 0.8 km in Bihr et al. 2015). Our results thus point to consistently lower line widths and temperatures than those found in other IRDCs, and closer to the typical values in nearby Gould Belt low-mass star-forming regions (e.g. Friesen et al. 2017).
It is plausible to assume that the velocity dispersions we find might also be suffering from an instrumental bias due to insufficient spectral resolution. There are two reasons why this does not diminish our findings. Firstly, the mean observed line width of 0.71 km is well resolved with the channel width of 0.2 km, and the ammonia emission, split among many hyperfine transitions, has its spectral line profile described across a large number of channels. Therefore, constraining the velocity dispersions is typically not a problem (mean uncertainty on velocity dispersions: 0.015 km). Secondly, even if there is a spectral resolution bias present, it will bias the obtained velocity dispersions towards larger values (Friesen et al. 2009), thus only strengthening our claim of the subsonic motion regime detection. We note that even if our analyses are repeated without subtracting the channel width from the observed line width, we still recover a significant fraction of the subsonic spectra (0.36 of the all the fitted components vs. the original 0.39 fraction). Additionally, the distribution of the line widths we obtain might be biased due to misidentification of the number of velocity components along the line of sight. As our heuristics to choose the number of components depend on all components in both ammonia lines being significantly detected, we expect a fraction of the multiple-component spectra to be fitted with a broader component model when those conditions are not met. This misspecification would only produce broader, not narrower, line widths, and may explain some Mach numbers in the tail of the Fig. 3 distribution, as well as a sharp, border-like transition in the northern part of the IRDC (Fig. 2). Despite this bias, 87% of the subsonic components belong to spectra with single velocity component.
Figure 3 shows a subsample of values derived within one FWHM of the synthesized VLA beam around the protostellar 70 μm sources identified in Nguyen Luong et al. (2011) alongside the remaining data. As seen from the figure, the overall distribution of the non-thermalmotions around the protostellar sources does not show a cleardeviation away from that of the rest of the IRDC, indicating that the embedded sources do not yet exert enough feedback on the surrounding material to disturb the cores that harbour them (at least not on the 0.07 pc scales resolved with our VLA observations). On the other hand, neither do the star-forming cores appear to resemble the “coherent core” picture of low-mass star formation (no correlation of ℳ = 0.91 with AV ; Pearson’s r = 0.10). It is likely thatto disentangle these effects, a higher-angular-resolution kinematics study is needed to resolve the densest gas structures, similar in size to the narrow (0.03 pc) filaments found in a recent ALMA continuum image of G035.39 (Henshaw et al. 2017). The importance of high-angular-resolution observationsis also shown by Hacar et al. (2018), who have recently resolved the Orion integral shaped filament into narrow 0.035 pc fibers of mostly subsonic nature, and a recent high-spectral-resolution study of SDC13 that shows localized traces of subsonic motions in the combined JVLA and GBT NH 3 observations (Williams et al. 2018). While future higher-angular-resolution studies dedicated to IRDC kinematics are needed in order to resolve the scales of the massive cores within the IRDCs, and probe the exact nature of transition into subsonic regime, our results show that some of the star-forming cores are forming in a quiescent environment.
The narrow ammonia line widths found in G035.39 indicate that due to reduced turbulent support parts of the IRDC are prone to gravitational collapse, unless they are supported by magnetic fields. Henshaw et al. (2016) find that magnetic field strengths of a few hundred microGauss are needed to virialize dense cores in the northern part of the IRDC, while Tan et al. (2013) have observed four massive clumps in a sample of ten well studied IRDCs from (2009, 2012), finding that magnetic fields of up to 1 mG strength are needed to support the cores in virial equilibrium (cf. ~ 2 mG in a follow-up study of Kong et al. 2017). Likewise, Zhang et al. (2015) analysed thermal dynamic properties of dense cores in IRDC G028.34, and found that a magnetic field strength of several milliGauss is required in order to virialize these cores. While the subsonic regions identified in our VLA observationsdo not always correspond to the density structure and therefore are not exclusively tracing the star-forming cores, we argue that by considering the largest bound ℳ < 1 contours to be magnetized cores in virial equilibrium we can arrive at an order of magnitude estimate of the magnetic field strength needed to support the enclosed region against collapse. For the three largest continuous subsonic islands in G035.39, each spanning in excess of seven VLA beam areas, we estimate masses of 22–45 M⊙ from the mass surface density map of (2013; or 18–21 M⊙ if the smallest value of mass surface density is representative of the line-of-sight contribution). For these values, assuming spherical core geometry, we follow the approach of Tan et al. (2013) to derive the magnetic field strengths of ~1.5–2 mGa (~0.8–1.8 mGa for the background subtraction case) needed to virialize the three regions.
Polarization studies of massive star-forming cores find that magnetic fields play an important role during their collapse and fragmentation (Zhang et al. 2014), and field strengths up to a few milliGauss are supporting active high-mass star-forming regions (Frau et al. 2014; Qiu et al. 2014; Li et al. 2015; Pillai et al. 2016). Recent polarization measurements towards early-stage IRDCs (Pillai et al. 2015; Santos et al. 2016; Beuther et al. 2018) find field strengths of a few hundred microGauss to a few milliGauss, that is, the same order as our estimates for G035.39. As G035.39 hosts a number of protostellar sources, it is clear that parts of the IRDC are already unstable or undergoing gravitational collapse. Dust polarization observations of G035.39, together with resolved kinematics tracing accreting and infalling motions of the dense gas, will reveal a comprehensive picture on the stability of this IRDC.
Our findings, enabled by high spectral resolution of the combined VLA and GBT observations, allow us to quantify the islands of subsonic turbulence within the IRDCs for the first time. The results of this work indicate that early stages of massive star and cluster formation can go through stages more similar to their low-mass counterparts than previously thought. We highlight the potential for high-angular- and spectral resolution ALMA observations of IRDC kinematics, needed to reevaluate the role of turbulent dissipation and investigate the exact nature of transition to coherence in early stages of massive star- and cluster-forming regions. If the subsonic regions found here are representative of the kinematics of the massive dense star-forming cores in other IRDCs, the reduced turbulent support and possible increased support from the magnetic fields put constraints on models and simulations aiming to reproduce the initial stages of massive star and cluster formation.
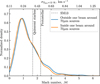 |
Fig. 3 KDE distribution of the non-thermal line widths to sound speed ratios in G035.39, peaking at ℳ = 0.91. The upper axis shows equivalent velocity dispersions for Tkin = 12 K, a mean temperature in our sample. A subsample extracted from pixels within one synthesized beam of the VLA around the 70 μm Herschel sources (Nguyen Luong et al. 2011) is shown in orange,alongside the remaining data plotted in blue. Overplotted for the reference are the mean values for starless and protostellar IRDC cores found in Sánchez-Monge et al. (2013). |
Acknowledgements
VS, JEP, and PC acknowledge the support from the European Research Council (ERC; project PALs 320620). KW is supported by grant WA3628-1/1 of the German Research Foundation (DFG) through the priority program 1573 (“Physics of the Interstellar Medium”). JCT acknowledges NASA grant 14-ADAP14-0135. IJ-S acknowledges the financial support received from the STFC through an Ernest Rutherford Fellowship (proposal number ST/L004801/2). This research made use of Astropy, a community-developed core Python package for Astronomy (Astropy Collaboration et al. 2013), and of APLpy, an open-source plotting package for Python (Robitaille & Bressert 2012).
References
- Astropy Collaboration, Robitaille, T. P., Tollerud, E. J., et al. 2013, A&A, 558, A33 [NASA ADS] [CrossRef] [EDP Sciences] [Google Scholar]
- Barnes, A. T., Kong, S., Tan, J. C., et al. 2016, MNRAS, 458, 1990 [NASA ADS] [CrossRef] [Google Scholar]
- Benson, P. J., & Myers, P. C. 1989, ApJS, 71, 89 [NASA ADS] [CrossRef] [Google Scholar]
- Beuther, H., Soler, J., Vlemmings, W., et al. 2018, A&A, in press, DOI: 10.1051/0004-6361/201732378 [Google Scholar]
- Bihr, S., Beuther, H., Linz, H., et al. 2015, A&A, 579, A51 [NASA ADS] [CrossRef] [EDP Sciences] [Google Scholar]
- Butler, M. J., & Tan, J. C. 2009, ApJ, 696, 484 [NASA ADS] [CrossRef] [Google Scholar]
- Butler, M. J., & Tan, J. C. 2012, ApJ, 754, 5 [NASA ADS] [CrossRef] [Google Scholar]
- Caselli, P., Benson, P. J., Myers, P. C., & Tafalla, M. 2002, ApJ, 572, 238 [NASA ADS] [CrossRef] [Google Scholar]
- Cornwell, T. J. 2008, IEEE J. Sel. Topics Signal Process., 2, 793 [Google Scholar]
- Dirienzo, W. J., Brogan, C., Indebetouw, R., et al. 2015, AJ, 150, 159 [Google Scholar]
- Foster, J. B., Rosolowsky, E. W., Kauffmann, J., et al. 2009, ApJ, 696, 298 [NASA ADS] [CrossRef] [Google Scholar]
- Frau, P., Girart, J. M., Zhang, Q., & Rao, R. 2014, A&A, 567, A116 [NASA ADS] [CrossRef] [EDP Sciences] [Google Scholar]
- Friesen, R. K., Di Francesco, J., Shirley, Y. L., & Myers, P. C. 2009, ApJ, 697, 1457 [NASA ADS] [CrossRef] [Google Scholar]
- Friesen, R. K., Pineda, J. E., co-PIs, et al. 2017, ApJ, 843, 63 [NASA ADS] [CrossRef] [Google Scholar]
- Ginsburg, A., & Mirocha, J. 2011, PySpecKit: Python Spectroscopic Toolkit, Astrophysics Source Code Library [Google Scholar]
- Goodman, A. A., Barranco, J. A., Wilner, D. J., & Heyer, M. H. 1998, ApJ, 504, 223 [NASA ADS] [CrossRef] [Google Scholar]
- Hacar, A., Tafalla, M., Forbrich, J., et al. 2018, A&A, 610, A77 [NASA ADS] [CrossRef] [EDP Sciences] [Google Scholar]
- Henshaw, J. D., Caselli, P., Fontani, F., Jiménez-Serra, I., & Tan, J. C. 2014, MNRAS, 440, 2860 [NASA ADS] [CrossRef] [Google Scholar]
- Henshaw, J. D., Caselli, P., Fontani, F., et al. 2016, MNRAS, 463, 146 [NASA ADS] [CrossRef] [Google Scholar]
- Henshaw, J. D., Jiménez-Serra, I., Longmore, S. N., et al. 2017, MNRAS, 464, L31 [NASA ADS] [CrossRef] [Google Scholar]
- Hernandez, A. K., Tan, J. C., Caselli, P., et al. 2011, ApJ, 738, 11 [NASA ADS] [CrossRef] [Google Scholar]
- Hernandez, A. K., Tan, J. C., Kainulainen, J., et al. 2012, ApJ, 756, L13 [NASA ADS] [CrossRef] [Google Scholar]
- Ho, P. T. P., & Townes, C. H. 1983, ARA&A, 21, 239 [NASA ADS] [CrossRef] [Google Scholar]
- Jiménez-Serra, I., Caselli, P., Fontani, F., et al. 2014, MNRAS, 439, 1996 [NASA ADS] [CrossRef] [Google Scholar]
- Kainulainen, J., & Tan, J. C. 2013, A&A, 549, A53 [NASA ADS] [CrossRef] [EDP Sciences] [Google Scholar]
- Kong, S., Tan, J. C., Caselli, P., et al. 2017, ApJ, submitted [arXiv:1701.05953] [Google Scholar]
- Larson, R. B. 1981, MNRAS, 194, 809 [NASA ADS] [CrossRef] [Google Scholar]
- Li, H.-B., Yuen, K. H., Otto, F., et al. 2015, Nature, 520, 518 [CrossRef] [Google Scholar]
- Liu, H. B., Jiménez-Serra, I., Ho, P. T. P., et al. 2012a, ApJ, 756, 10 [NASA ADS] [CrossRef] [Google Scholar]
- Liu, H. B., Quintana-Lacaci, G., Wang, K., et al. 2012b, ApJ, 745, 61 [NASA ADS] [CrossRef] [Google Scholar]
- Liu, H. B., Galván-Madrid, R., Jiménez-Serra, I., et al. 2015, ApJ, 804, 37 [NASA ADS] [CrossRef] [Google Scholar]
- Lu, X., Zhang, Q., Liu, H. B., Wang, J., & Gu, Q. 2014, ApJ, 790, 84 [NASA ADS] [CrossRef] [Google Scholar]
- Mangum, J. G., & Shirley, Y. L. 2015, PASP, 127, 266 [NASA ADS] [CrossRef] [Google Scholar]
- McKee, C. F., & Tan, J. C. 2003, ApJ, 585, 850 [NASA ADS] [CrossRef] [MathSciNet] [Google Scholar]
- Nguyen Luong, Q., Motte, F., Hennemann, M., et al. 2011, A&A, 535, A76 [NASA ADS] [CrossRef] [EDP Sciences] [Google Scholar]
- Peretto, N., Fuller, G. A., Duarte-Cabral, A., et al. 2013, A&A, 555, A112 [NASA ADS] [CrossRef] [EDP Sciences] [Google Scholar]
- Pillai, T., Kauffmann, J., Tan, J. C., et al. 2015, ApJ, 799, 74 [NASA ADS] [CrossRef] [Google Scholar]
- Pillai, T., Kauffmann, J., Wiesemeyer, H., & Menten, K. M. 2016, A&A, 591, A19 [NASA ADS] [CrossRef] [EDP Sciences] [Google Scholar]
- Pineda, J. E., Goodman, A. A., Arce, H. G., et al. 2010, ApJ, 712, L116 [NASA ADS] [CrossRef] [Google Scholar]
- Qiu, K., Zhang, Q., Menten, K. M., et al. 2014, ApJ, 794, L18 [Google Scholar]
- Ragan, S. E., Heitsch, F., Bergin, E. A., & Wilner, D. 2012, ApJ, 746, 174 [NASA ADS] [CrossRef] [Google Scholar]
- Robitaille, T., & Bressert, E. 2012, APLpy: Astronomical Plotting Library in Python, Astrophysics Source Code Library [Google Scholar]
- Sánchez-Monge, Á., Palau, A., Fontani, F., et al. 2013, MNRAS, 432, 3288 [NASA ADS] [CrossRef] [Google Scholar]
- Santos, F. P., Busquet, G., Franco, G. A. P., Girart, J. M., & Zhang, Q. 2016, ApJ, 832, 186 [NASA ADS] [CrossRef] [Google Scholar]
- Simon, R., Rathborne, J. M., Shah, R. Y., Jackson, J. M., & Chambers, E. T. 2006, ApJ, 653, 1325 [NASA ADS] [CrossRef] [Google Scholar]
- Sokolov, V., Wang, K., Pineda, J. E., et al. 2017, A&A, 606, A133 [NASA ADS] [CrossRef] [EDP Sciences] [Google Scholar]
- Tan, J. C., Kong, S., Butler, M. J., Caselli, P., & Fontani, F. 2013, ApJ, 779, 96 [NASA ADS] [CrossRef] [Google Scholar]
- Tan, J. C., Beltrán, M. T., Caselli, P., et al. 2014, Protostars and Planets VI (Tucson, AZ: Univ. Arizona Press), 149 [Google Scholar]
- Williams, G. M., Peretto, N., Avison, A., Duarte-Cabral, A., & Fuller, G. A. 2018, A&A, in press, DOI: 10.1051/0004-6361/201731587 [Google Scholar]
- Wyrowski, F., Güsten, R., Menten, K. M., et al. 2016, A&A, 585, A149 [NASA ADS] [CrossRef] [EDP Sciences] [Google Scholar]
- Zhang, Q., Qiu, K., Girart, J. M., et al. 2014, ApJ, 792, 116 [NASA ADS] [CrossRef] [Google Scholar]
- Zhang, Q., Wang, K., Lu, X., & Jiménez-Serra, I. 2015, ApJ, 804, 141 [NASA ADS] [CrossRef] [Google Scholar]
When inspected, no individual spectrum appeared to contain more that three distinct velocity components.
All Figures
|
Fig. 1 Left to right: combined VLA+GBT integrated intensities of the observed ammonia (1,1) and (2,2) lines, computed between 42 and 47 km. The white dotted contour marks the significance level of the integrated intensity of each line at the 3σI level, where σI is the integrated intensity uncertainty (Mangum & Shirley 2015). The white solid contours show the infrared extinction contours (Kainulainen & Tan 2013) starting from AV = 30 mag and progressing inwards in steps of 30 mag. The open and filled red stars denote the positions of the Herschel sources from Nguyen Luong et al. (2011) below and above 20 M⊙, respectively, while the open diamonds mark the location of cores from (2009, 2012). |
| In the text | |
|
Fig. 2 A map of the non-thermal velocity dispersion to the gas sound speed in G035.39. In pixels where multiple velocity components are discovered, the smallest value is shown on the image (the analyses throughout the rest of this work use all the values). The markers are the same as in Fig. 1, and the solid white line contours indicate the transition at σnt ∕cs = 1. The side panels to the left and right of the map show (1,1) and (2,2) spectra towards the numbered positions. The spectra are overlaid with their best-fit model, with individual velocity components plotted in colour. The topmost spectra, unlike the others, show an averaged spectrum across the subsonic island at α(J2000) = 18h57m08s, δ(J2000) = +2∘09′45′′. An independently conducted fit, shown in red, yields ℳ = 0.72 ± 0.04. |
| In the text | |
|
Fig. 3 KDE distribution of the non-thermal line widths to sound speed ratios in G035.39, peaking at ℳ = 0.91. The upper axis shows equivalent velocity dispersions for Tkin = 12 K, a mean temperature in our sample. A subsample extracted from pixels within one synthesized beam of the VLA around the 70 μm Herschel sources (Nguyen Luong et al. 2011) is shown in orange,alongside the remaining data plotted in blue. Overplotted for the reference are the mean values for starless and protostellar IRDC cores found in Sánchez-Monge et al. (2013). |
| In the text | |
Current usage metrics show cumulative count of Article Views (full-text article views including HTML views, PDF and ePub downloads, according to the available data) and Abstracts Views on Vision4Press platform.
Data correspond to usage on the plateform after 2015. The current usage metrics is available 48-96 hours after online publication and is updated daily on week days.
Initial download of the metrics may take a while.