Fig. 3
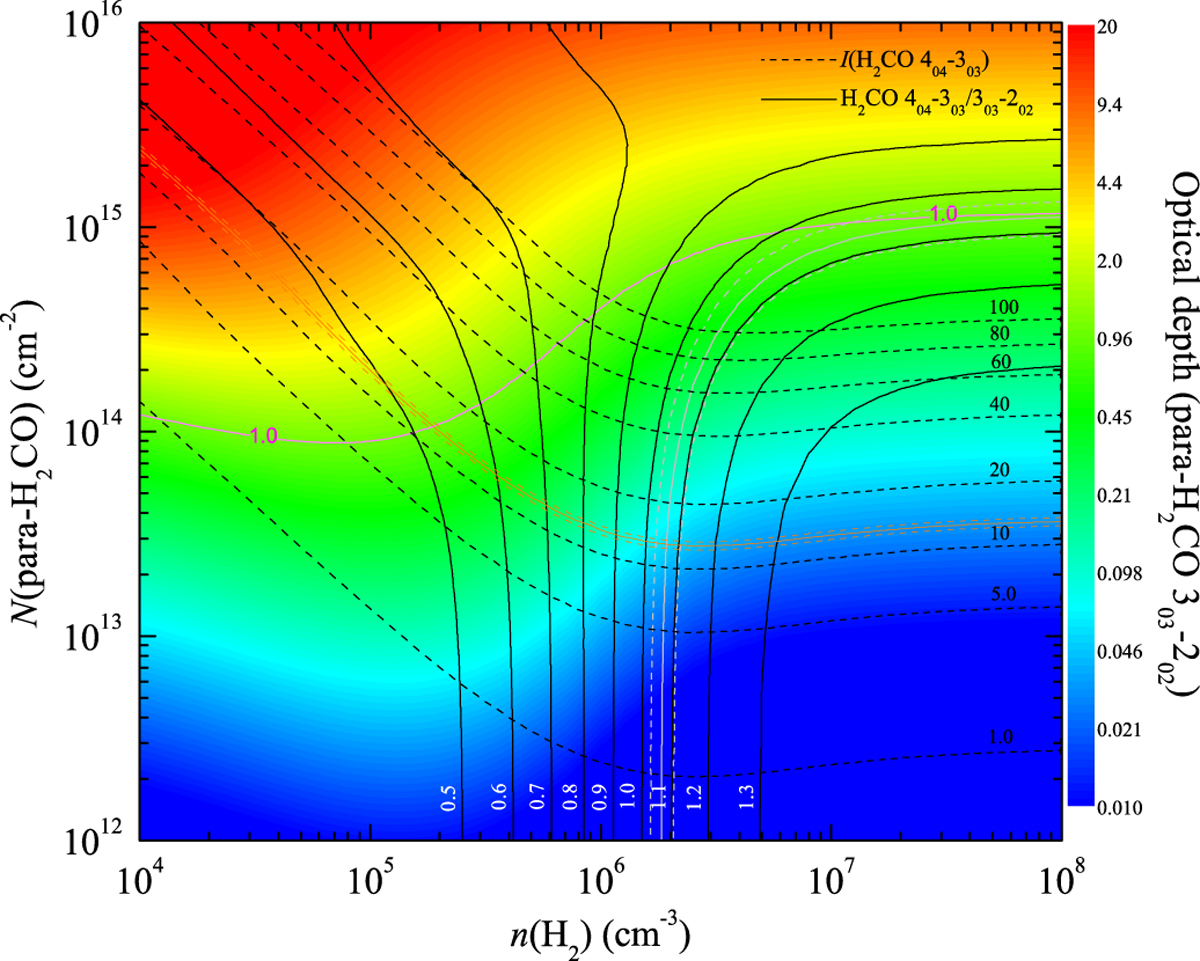
Example of RADEX non-LTE modelling of the N(H2CO)–n(H2) relation for AGAL008.684−00.367 at a kinetic temperature of 55 K (see Sect. 3.4). Black dashed and solid lines are para-H2 CO 404–303 integrated intensities and para-H2CO 404–303/303–202 integrated intensity ratios, respectively. Tothe measured parameters, para-H2 CO 404–303 integrated intensity (orange solid and dashed lines represent observed value and uncertainty) and para-H2 CO 404–303/303–202 integrated intensity ratio (white solid and dashed lines) are corrected by the relevant beam-filling factors (see Table A.6). The colour map shows the optical depth of the para-H2 CO 303–202 line. The purple line in the upper green area corresponds to optical depth τ(para-H2CO 303–202) = 1.0.
Current usage metrics show cumulative count of Article Views (full-text article views including HTML views, PDF and ePub downloads, according to the available data) and Abstracts Views on Vision4Press platform.
Data correspond to usage on the plateform after 2015. The current usage metrics is available 48-96 hours after online publication and is updated daily on week days.
Initial download of the metrics may take a while.