Fig. 4
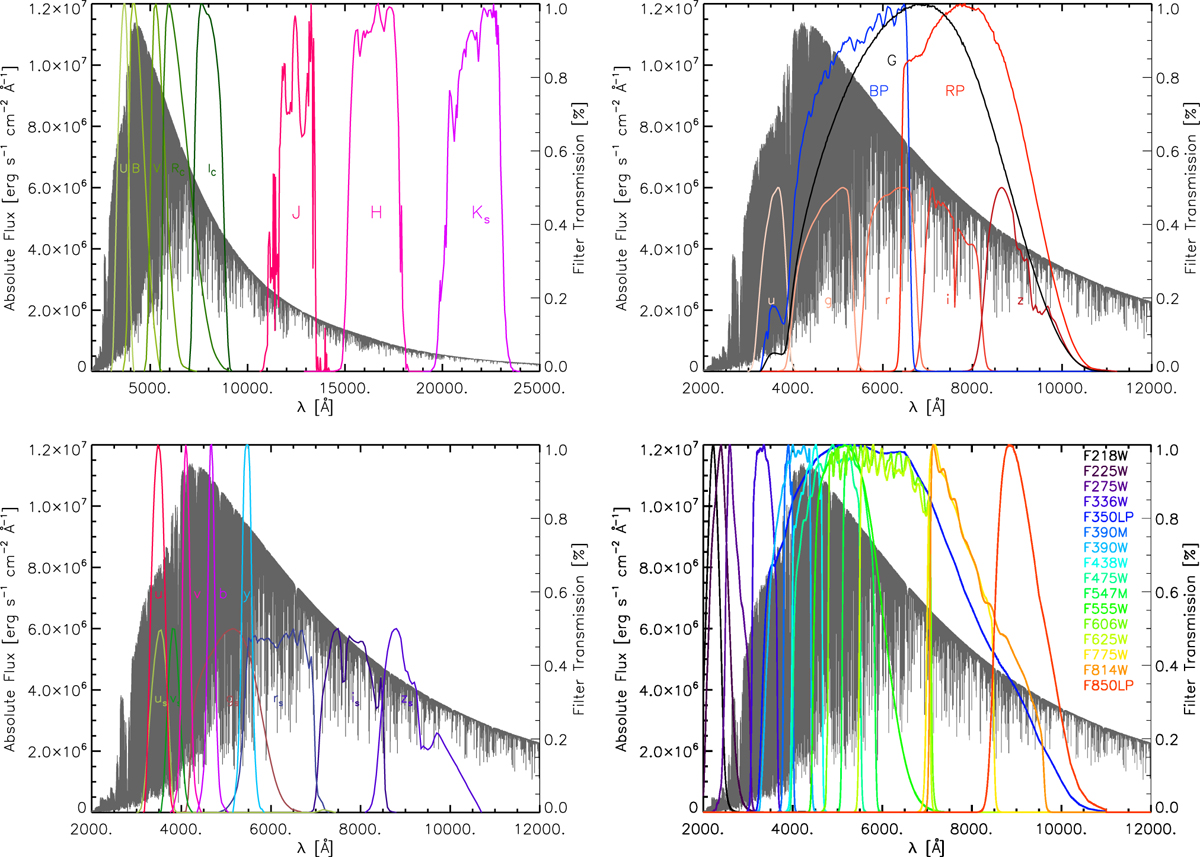
Synthetic spectrum of the solar simulation at full spectral resolution in the spectral range 2000–25 000 Å (grey, top panel) and 2000–12 000 Å (central and bottom panels). Several system response functions (Table 1), from which synthetic colours have been computed, are overplotted. Johnson-Cousins system response functions (U, B, V, Rc, Ic) are plotted in green and 2MASS in pink-violet (top left panel); SDSS (u, g, r, i, z) in yellow-red and Gaia (BP, RP, G) (top right panel); Strömgren (uvby) in red-blue and SkyMapper (us , vs , gs, rs, is, zs) (bottom left panel); and the 15 filters of the HST-WFC3 (bottom right panel). For clarity, SDSS and SkyMapper functions are normalised to 0.5.
Current usage metrics show cumulative count of Article Views (full-text article views including HTML views, PDF and ePub downloads, according to the available data) and Abstracts Views on Vision4Press platform.
Data correspond to usage on the plateform after 2015. The current usage metrics is available 48-96 hours after online publication and is updated daily on week days.
Initial download of the metrics may take a while.