Free Access
Fig. 7
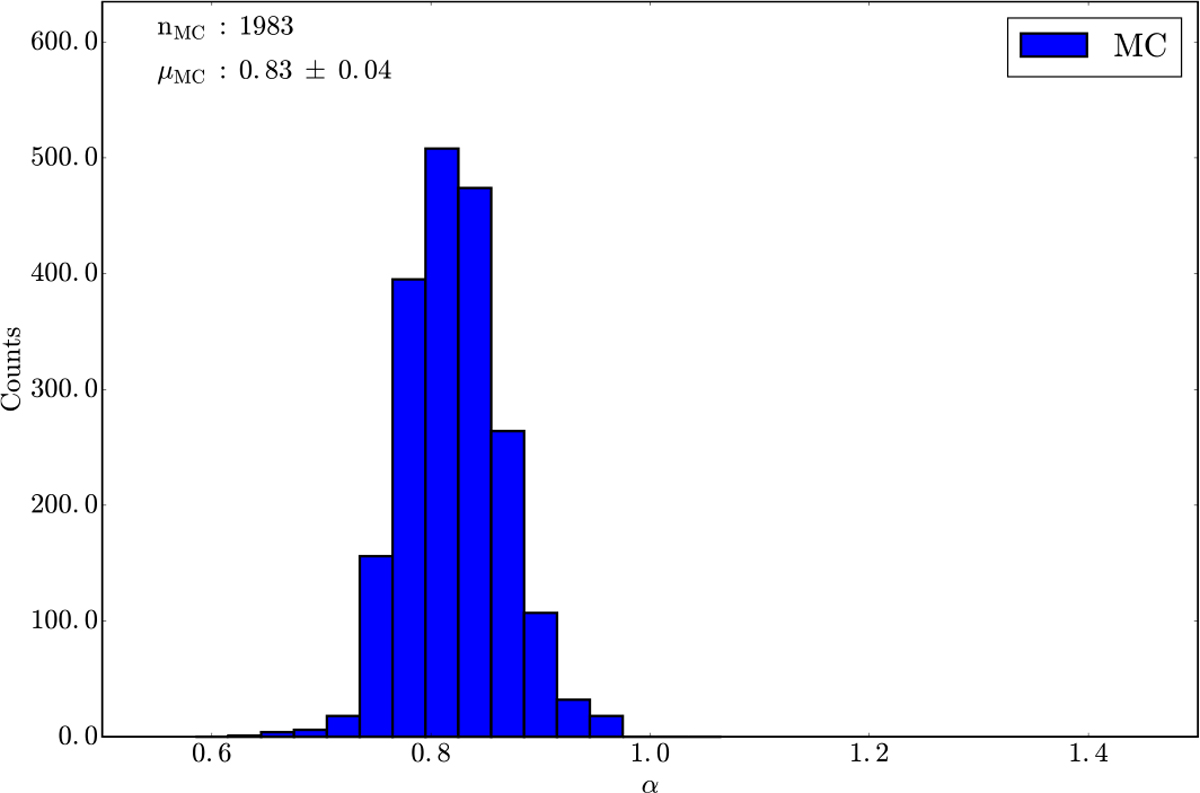
Histogram of α
located at the peak value of ![]() to Nin (ac, C, dC, pV, α) in each of the ~2000 trials repeating the V -shape technique for the Erigone family. The mean of the distribution is centered at
α
= 0.83 ± 0.04 and the bin size in the histogram is 0.03.
to Nin (ac, C, dC, pV, α) in each of the ~2000 trials repeating the V -shape technique for the Erigone family. The mean of the distribution is centered at
α
= 0.83 ± 0.04 and the bin size in the histogram is 0.03.
Current usage metrics show cumulative count of Article Views (full-text article views including HTML views, PDF and ePub downloads, according to the available data) and Abstracts Views on Vision4Press platform.
Data correspond to usage on the plateform after 2015. The current usage metrics is available 48-96 hours after online publication and is updated daily on week days.
Initial download of the metrics may take a while.