Free Access
Fig. 11
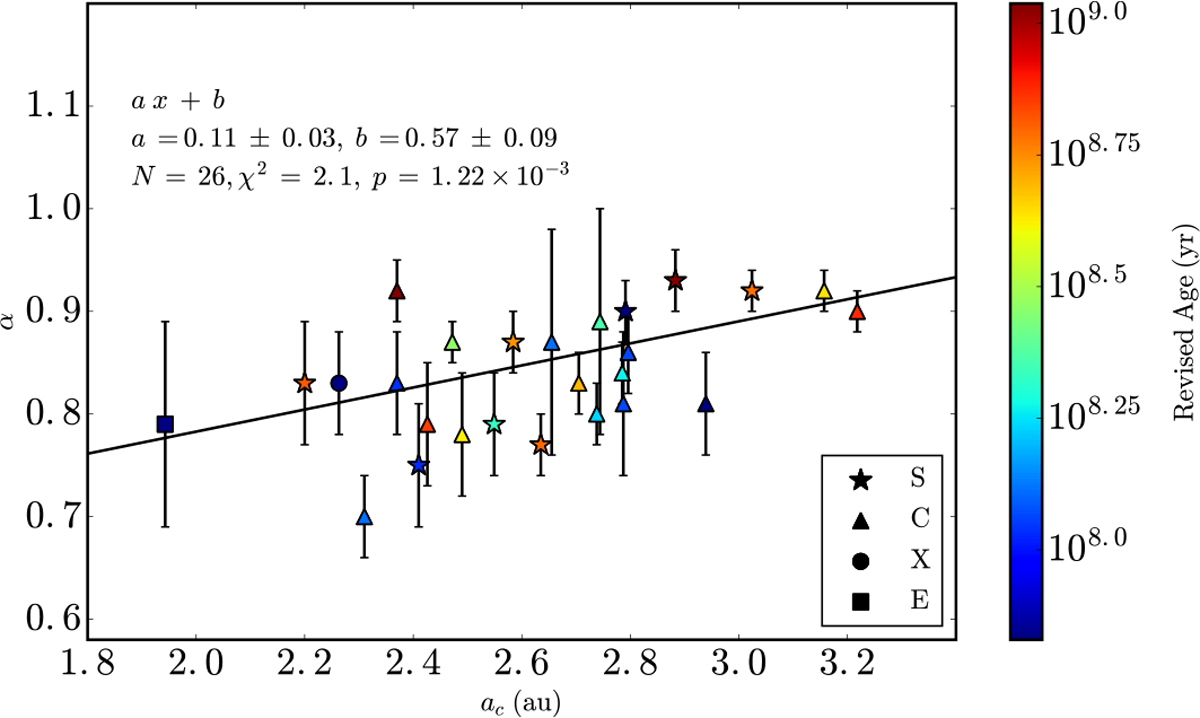
ac vs. α vs. revised age for asteroid families of all taxonomies. The Eos asteroid family is labeled as an S-type in this plot. The data are fit to the function y = a x + b in ac vs. α space, which is shown as the dark line using orthogonal distance regression (Boggs & Rogers 1990).
Current usage metrics show cumulative count of Article Views (full-text article views including HTML views, PDF and ePub downloads, according to the available data) and Abstracts Views on Vision4Press platform.
Data correspond to usage on the plateform after 2015. The current usage metrics is available 48-96 hours after online publication and is updated daily on week days.
Initial download of the metrics may take a while.