Fig. 4
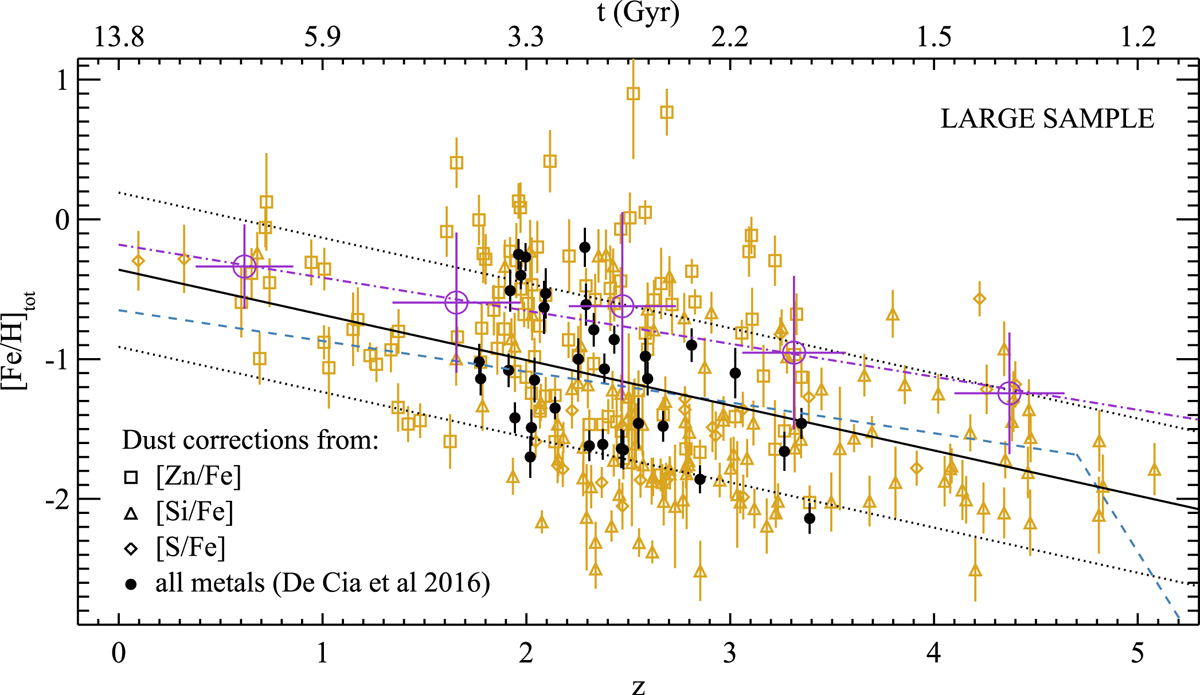
Dust-corrected metallicities [M/H]tot derived from several metals simultaneously in Paper I (black filled circles), and the dust-corrected metallicities [Fe/H]tot calculated with the single-reference method (Sect. 2) for the large sample (gold open symbols). The shape of the symbols show which reference was used for the dust correction, as labeled. The black solid and dotted lines display the linear fit to the data and the intrinsic scatter of the relation, respectively. The large open purple circles show the mean DLA metallicities weighted for the N(H i) content, in bins of redshift, and the linear fit to these points is shown by the dotted-dashed purple line. The dashed blue curve shows the average DLA metallicity derived by Rafelski et al. (2012) – originally derived for a scale of [Si/H] and weighted by the N(H i) content – and the drop at high z suggested by Rafelski et al. (2014).
Current usage metrics show cumulative count of Article Views (full-text article views including HTML views, PDF and ePub downloads, according to the available data) and Abstracts Views on Vision4Press platform.
Data correspond to usage on the plateform after 2015. The current usage metrics is available 48-96 hours after online publication and is updated daily on week days.
Initial download of the metrics may take a while.