Fig. 6
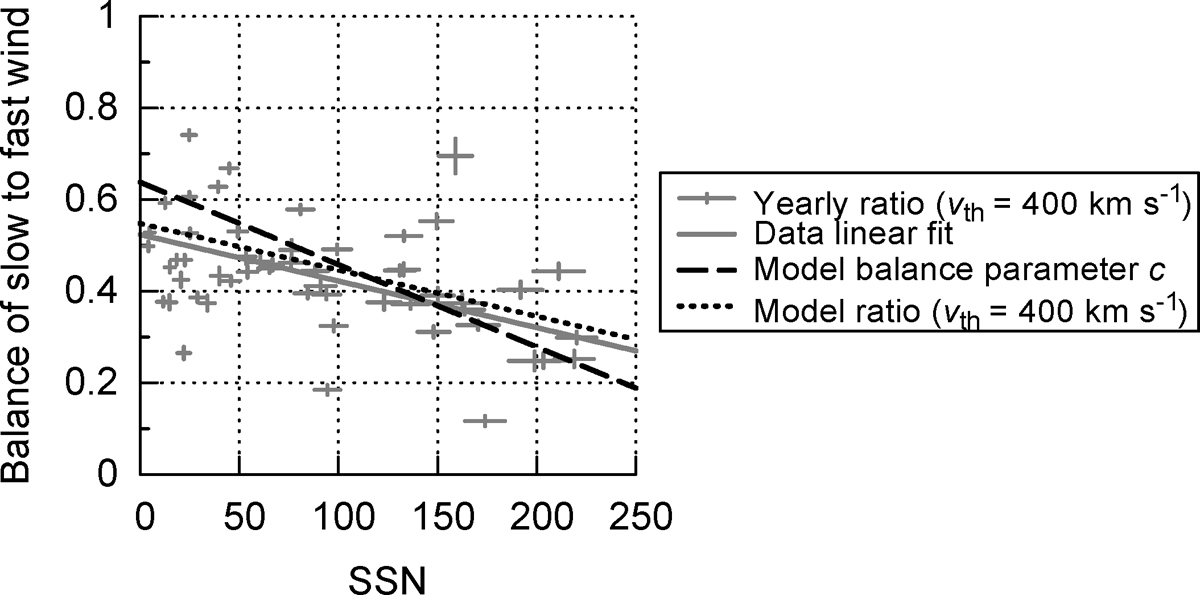
Ratio of slow to fast solar wind for a SSN lagged by 3 yr. The yearly ratios (+) and their weighted linear fit (solid line) are obtained from OMNI data with a threshold velocity of vth = 400 km s−1. The error bars denote the SSN standard deviation and the relative weight from the yearly data coverage. The model’s balance parameter (9) and derived ratio (same threshold) are plotted as dashed and dotted lines.
Current usage metrics show cumulative count of Article Views (full-text article views including HTML views, PDF and ePub downloads, according to the available data) and Abstracts Views on Vision4Press platform.
Data correspond to usage on the plateform after 2015. The current usage metrics is available 48-96 hours after online publication and is updated daily on week days.
Initial download of the metrics may take a while.