Free Access
Fig. 2
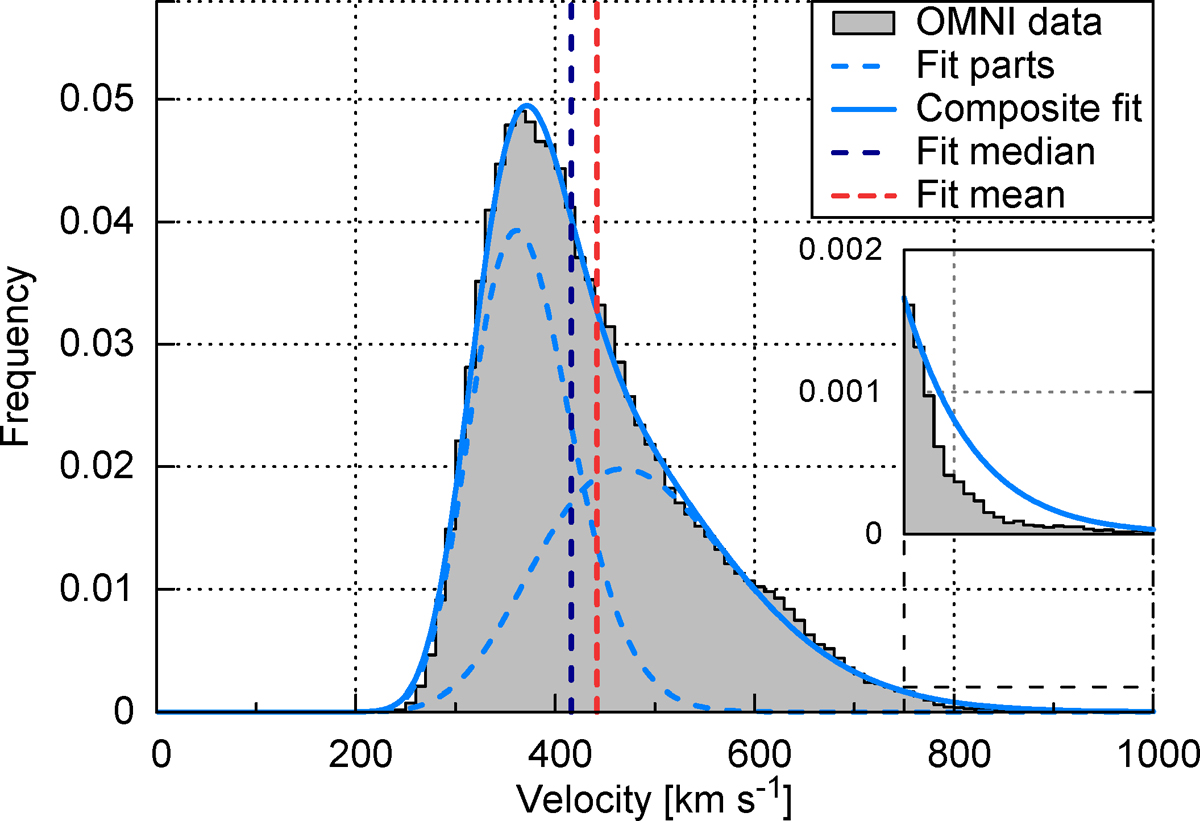
Velocity frequency distribution (same as in Fig. 1) and its compositional lognormal fit. The fit’smedian and mean values and its two fit parts are indicated as well. The inset is a zoomed-in view of the high value tail of the distribution.
Current usage metrics show cumulative count of Article Views (full-text article views including HTML views, PDF and ePub downloads, according to the available data) and Abstracts Views on Vision4Press platform.
Data correspond to usage on the plateform after 2015. The current usage metrics is available 48-96 hours after online publication and is updated daily on week days.
Initial download of the metrics may take a while.