Fig. 9
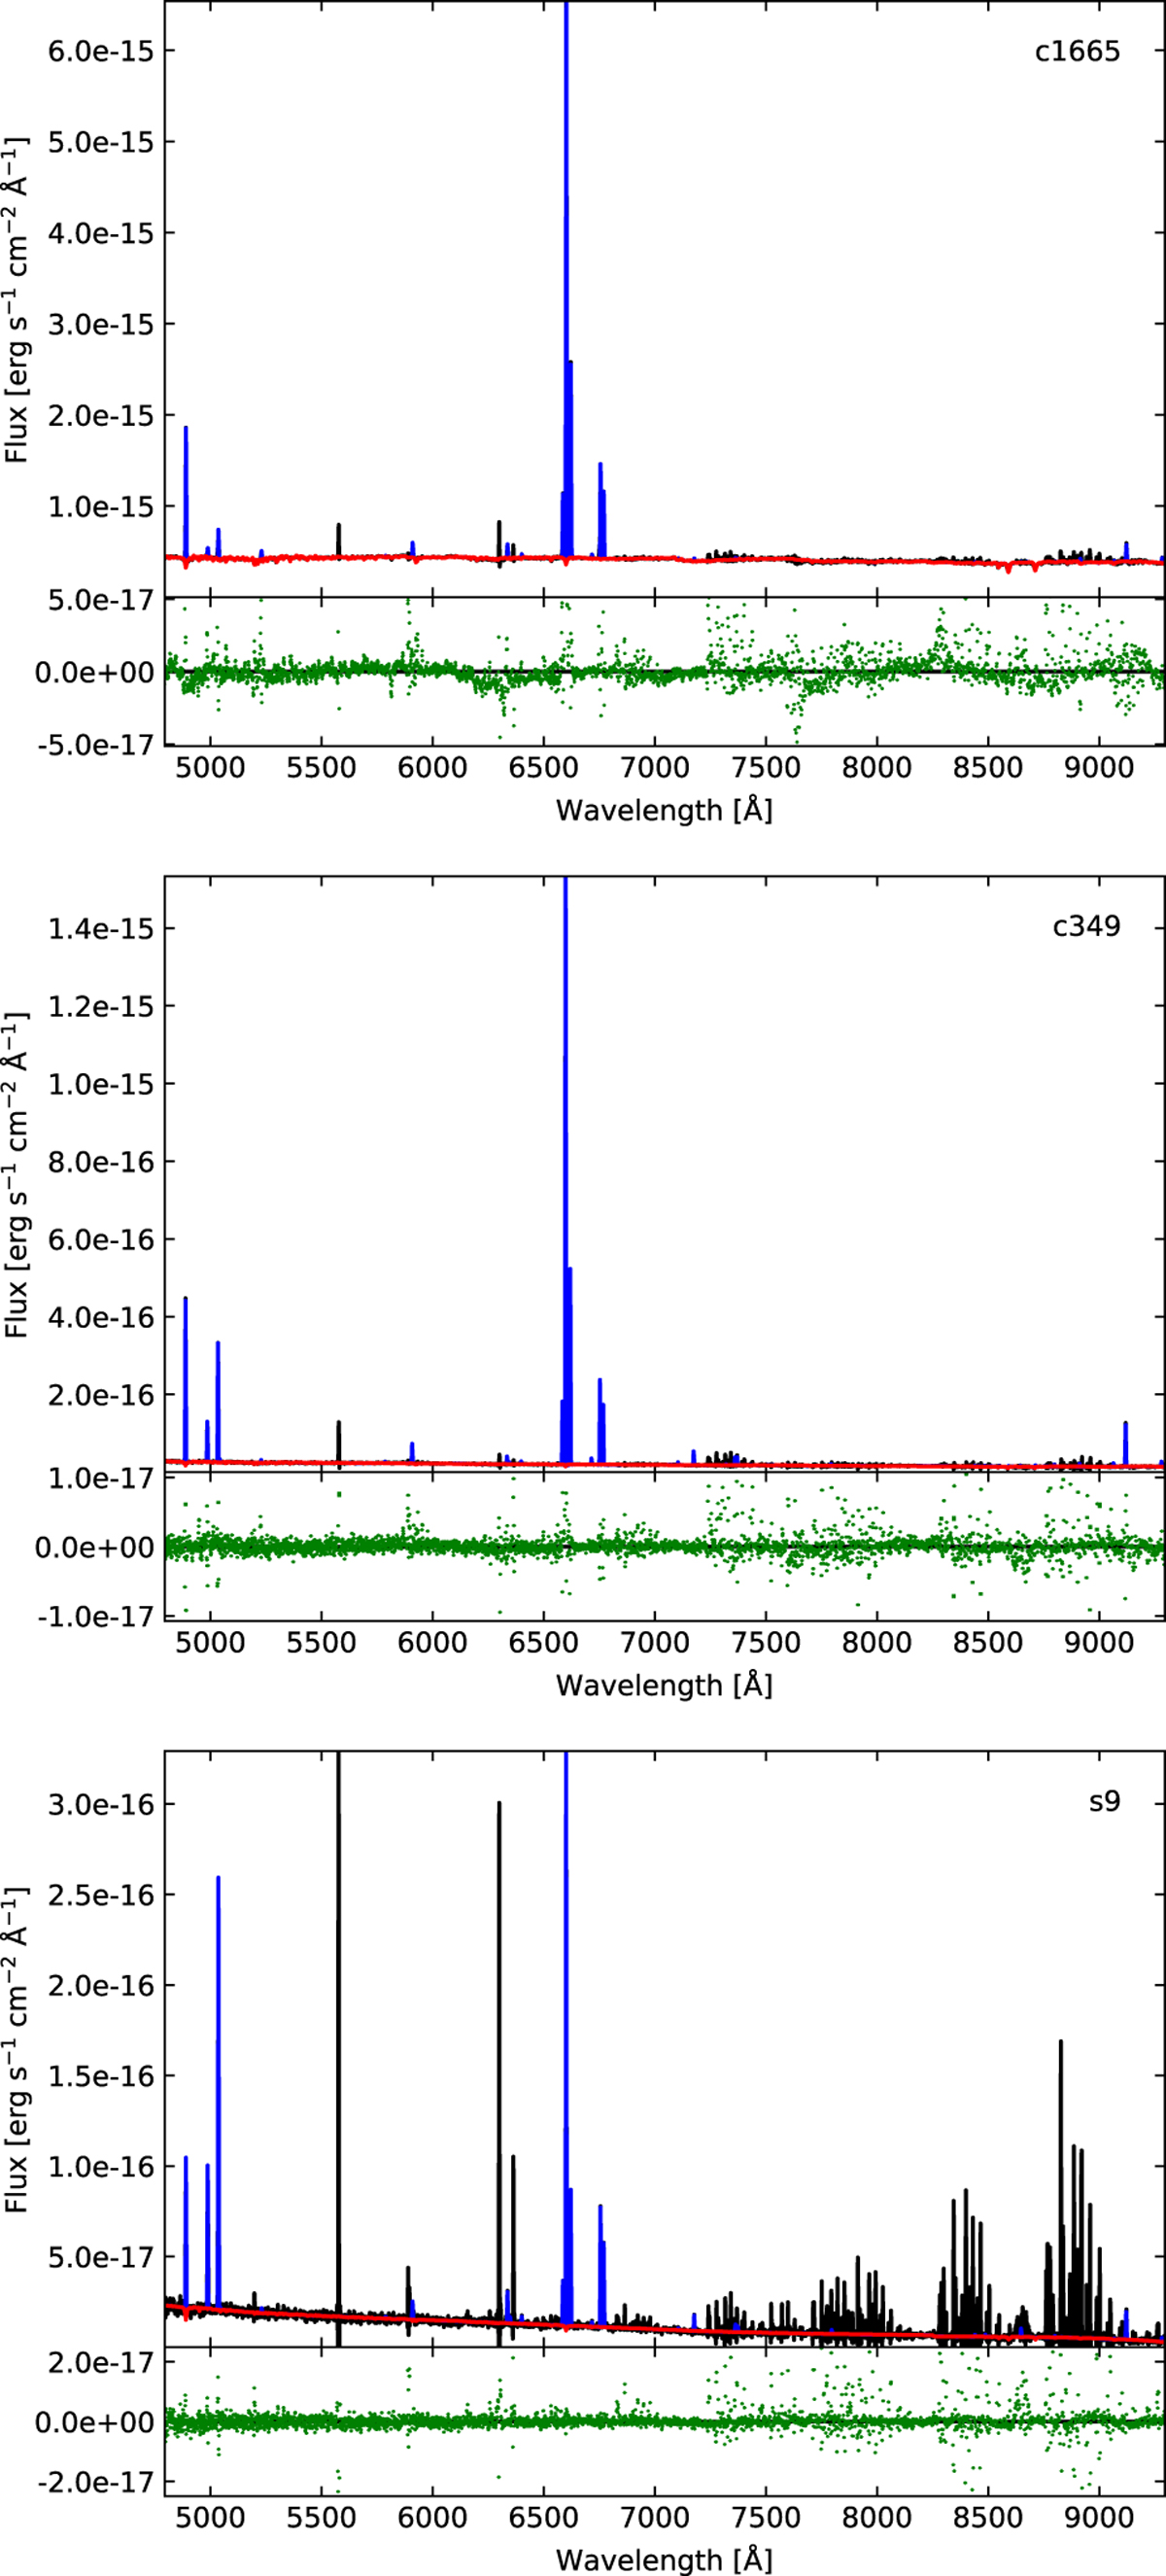
Three example spectra of H II regions: c1665 is located near the NGC4038 nucleus, c349 is in the tidal tail of the central field, s9 is in the southern field. The corresponding regions are annotated in Fig. 8. In each upper panel, the black line shows the extracted data, the red line is the continuum fit and the blue lines represent the fit to gas emission. The green points with error bars in the lower panels show the residuals of the pPXF fit.
Current usage metrics show cumulative count of Article Views (full-text article views including HTML views, PDF and ePub downloads, according to the available data) and Abstracts Views on Vision4Press platform.
Data correspond to usage on the plateform after 2015. The current usage metrics is available 48-96 hours after online publication and is updated daily on week days.
Initial download of the metrics may take a while.