Free Access
Fig. 8
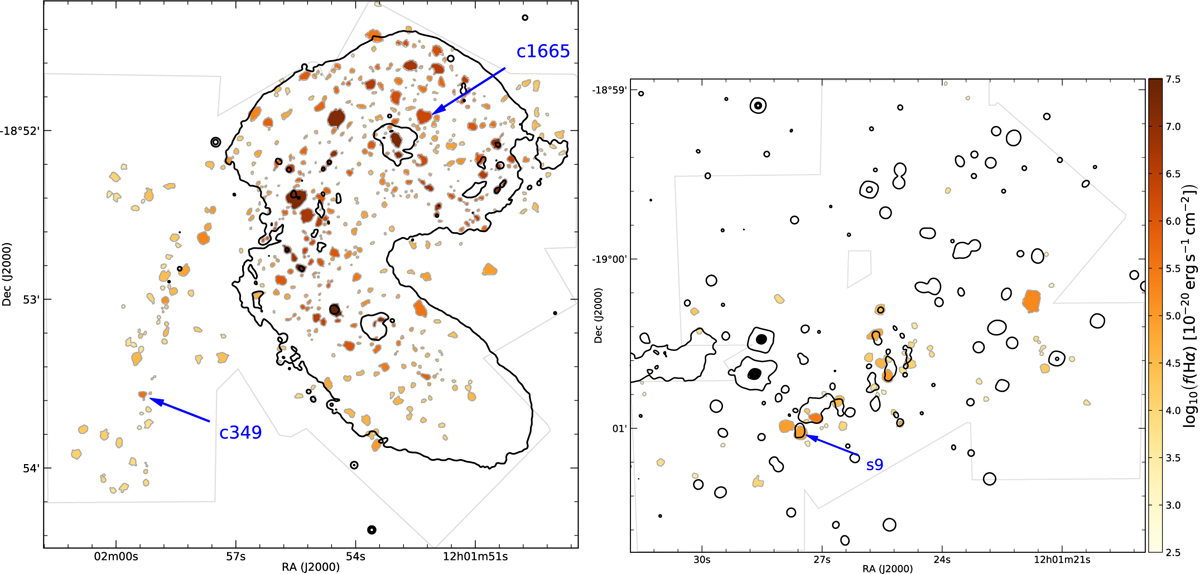
H II regions detected in the Antennae using the ASTRODENDRO package. The common color-scale gives the Hα flux of each region. Left panel: central region; right panel: southern region. The contours are the same broad-band levels as in Fig. 1. H II regions whose spectra are displayed in Fig. 9 are marked.
Current usage metrics show cumulative count of Article Views (full-text article views including HTML views, PDF and ePub downloads, according to the available data) and Abstracts Views on Vision4Press platform.
Data correspond to usage on the plateform after 2015. The current usage metrics is available 48-96 hours after online publication and is updated daily on week days.
Initial download of the metrics may take a while.