Fig. 6
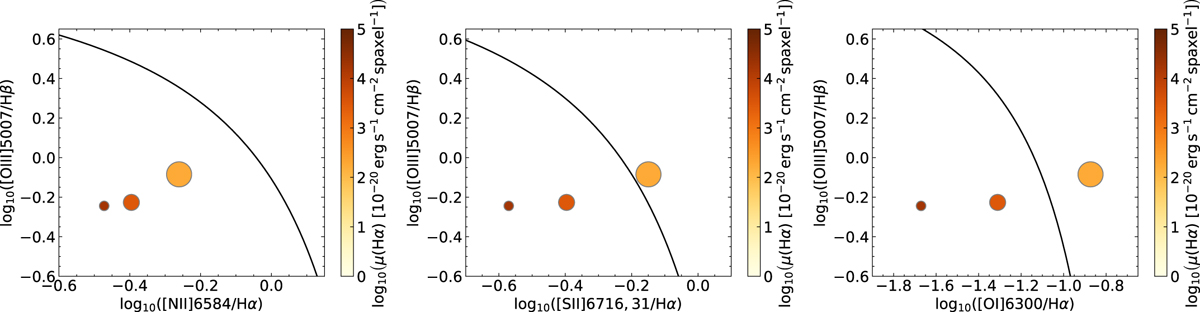
Diagnostic diagrams showing the properties of the faint ionized gas. The radius of the three data points in each panel scales linearly to the square-root of the area, and the error bars aresmaller than the size of the points. The color is coded according to the average Hα surface brightness. The solid line indicates the nominal photoionization limit of Kewley et al. (2001).
Current usage metrics show cumulative count of Article Views (full-text article views including HTML views, PDF and ePub downloads, according to the available data) and Abstracts Views on Vision4Press platform.
Data correspond to usage on the plateform after 2015. The current usage metrics is available 48-96 hours after online publication and is updated daily on week days.
Initial download of the metrics may take a while.