Free Access
Fig. 5
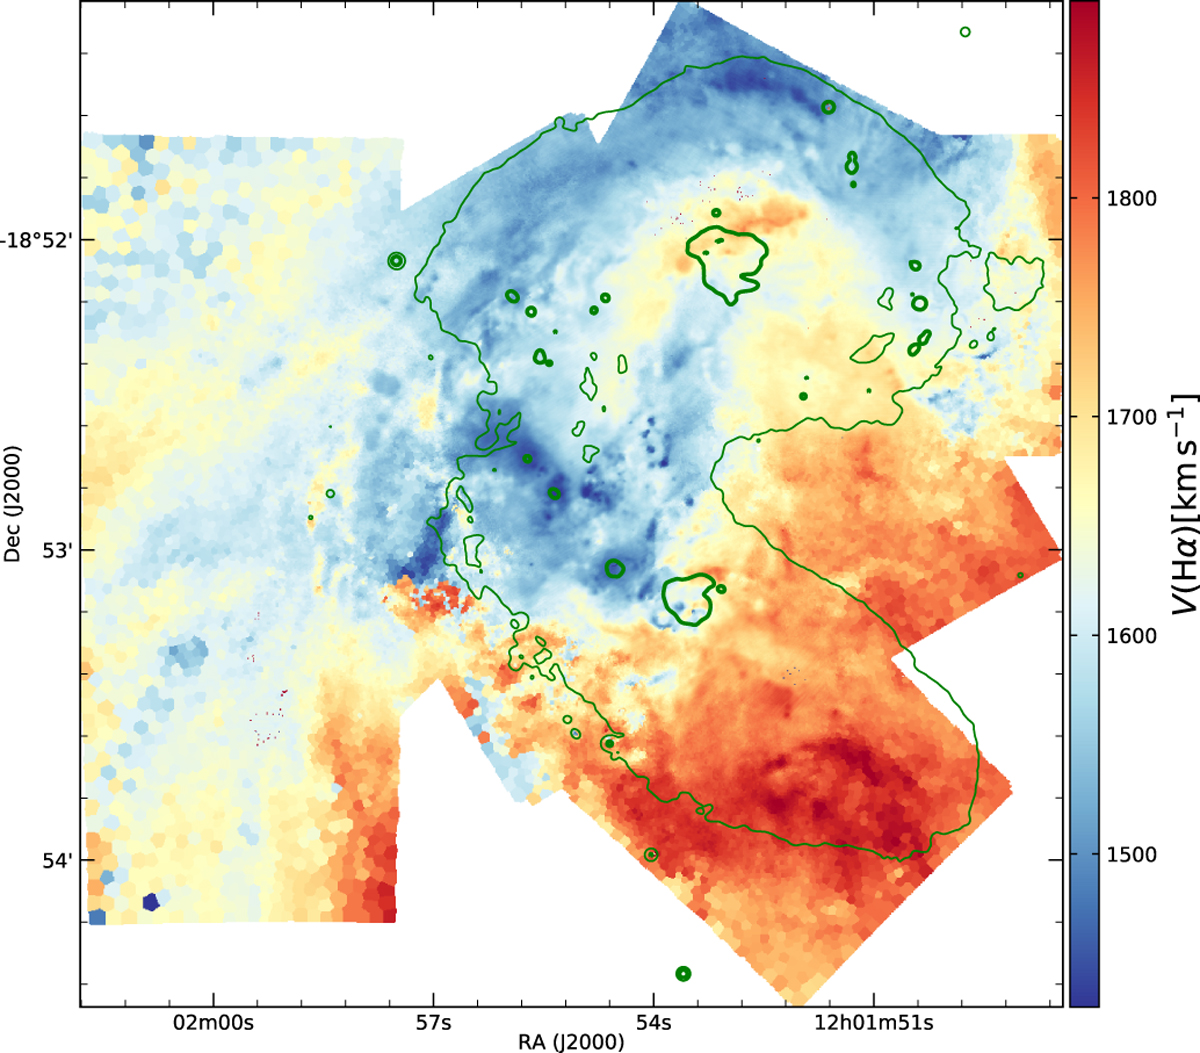
Velocity derived from the Hα emission line in the central field of the Antennae. The velocities are corrected to the solar-system barycenter and are computed over bins of S∕N ~ 30 (see text). The green lines are the same HST broad-band contours as in Fig. 1.
Current usage metrics show cumulative count of Article Views (full-text article views including HTML views, PDF and ePub downloads, according to the available data) and Abstracts Views on Vision4Press platform.
Data correspond to usage on the plateform after 2015. The current usage metrics is available 48-96 hours after online publication and is updated daily on week days.
Initial download of the metrics may take a while.