Fig. 4
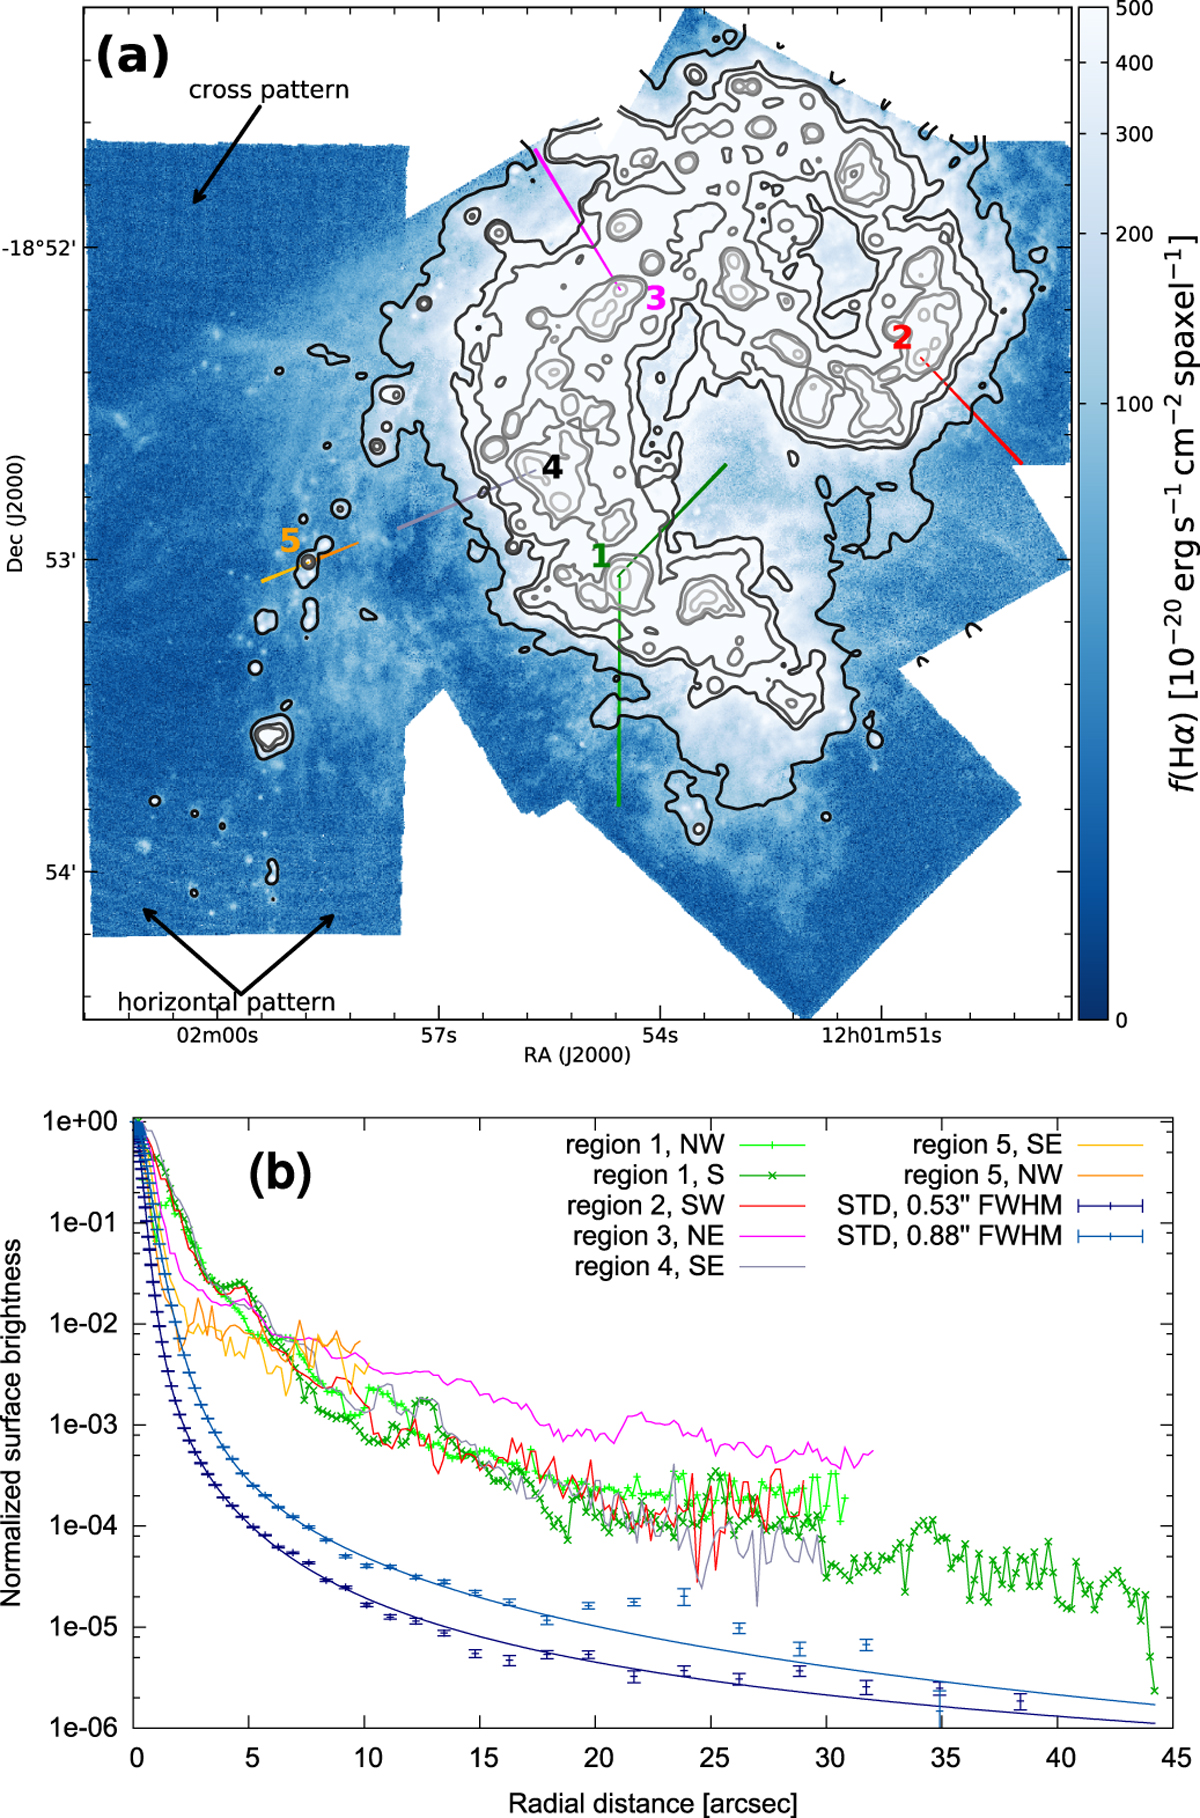
Radial profiles of the Hα surface brightness compared to the point spread function (PSF) as derived from two typical standard star observations. Panel a: Hα flux map from Gaussian line fits to the emission line, comparable to Fig. 3a, but with radial extraction cuts marked and the corresponding Hα peaks numbered. Low-level patterns caused by the correlated noise in the MUSE cubes are marked with arrows. Panel b: radial flux distribution outwards from the HII regions. The markers in the map and the corresponding profiles are shown with the same color. The PSFs derived from the standard stars are shown as elliptical profiles with error bars and triple Moffat fits.
Current usage metrics show cumulative count of Article Views (full-text article views including HTML views, PDF and ePub downloads, according to the available data) and Abstracts Views on Vision4Press platform.
Data correspond to usage on the plateform after 2015. The current usage metrics is available 48-96 hours after online publication and is updated daily on week days.
Initial download of the metrics may take a while.