Fig. 3
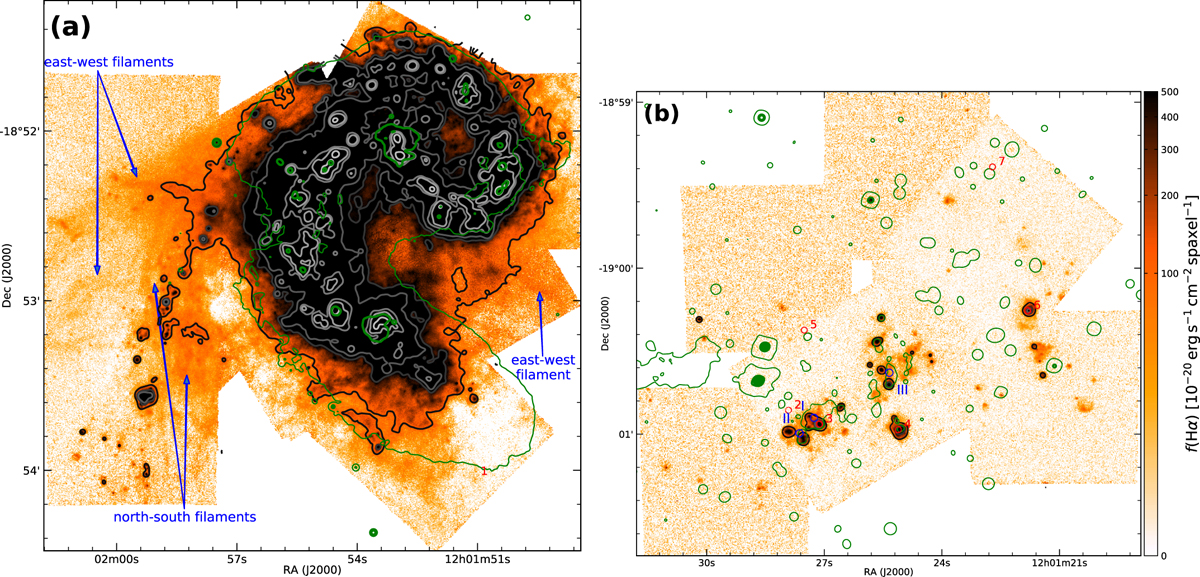
Continuum-subtracted Hα flux maps for the central (panel a) and the southern (panel b) region, as produced by the narrow-band technique (see text). The common color scaling (color bar on the right) was chosen to highlight faint features. The black-to-gray contours denote the Hα flux levels, smoothed by a 3-pixel Gaussian, of 2.50 × 10⁻¹⁷, 1.25 × 10⁻¹⁶, 2.50 × 10⁻¹⁶, 1.25 × 10⁻¹⁵, 2.50 × 10⁻¹⁵, and 1.25 × 10⁻¹⁴ erg s−1 cm−2 arcsec−2; since the emission in the southern region is fainter, not all contours are visible in panel b. The green contours highlight continuum features and are identical to those shown in Fig. 1. In panel b, the blue circles and corresponding roman numerals denote the detections by Mirabel et al. (1992) with coordinates from Hibbard et al. (2001), while the red circles and arabic numerals are detections by Bournaud et al. (2004).
Current usage metrics show cumulative count of Article Views (full-text article views including HTML views, PDF and ePub downloads, according to the available data) and Abstracts Views on Vision4Press platform.
Data correspond to usage on the plateform after 2015. The current usage metrics is available 48-96 hours after online publication and is updated daily on week days.
Initial download of the metrics may take a while.