Fig. 2
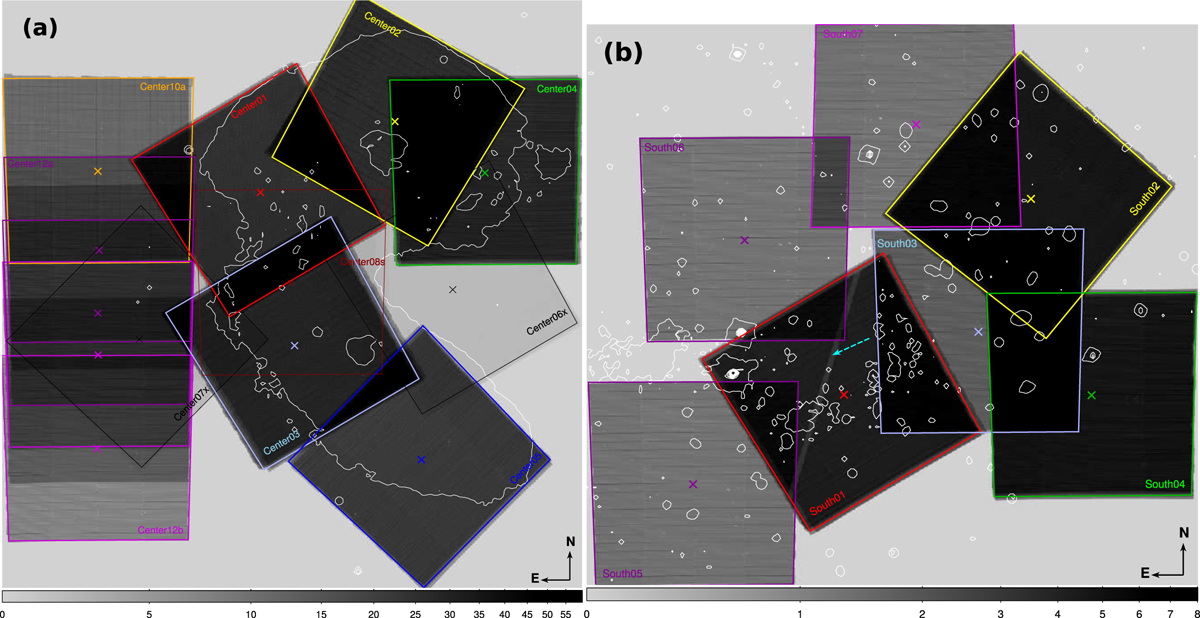
Inverse gray-scale map of the relative weights of the data of the MUSE data of the Antennae. In this representation, the deepest regions appear black while those parts of the data only covered by exposures taken in poor conditions appear light gray. In color, boxes representing the MUSE fields (each approx. 1′× 1′ in size) are shown, with the annotated field designation and a cross marking the field center. The white contours are similar to the continuum levels shown in Fig. 1. Panel a: pointings of the central Antennae; panel b: pointings around the tip of the southern tidal tail are presented. Panel b: a removed satellite trail that decreased the effective exposure time is marked with a dashed cyan arrow.
Current usage metrics show cumulative count of Article Views (full-text article views including HTML views, PDF and ePub downloads, according to the available data) and Abstracts Views on Vision4Press platform.
Data correspond to usage on the plateform after 2015. The current usage metrics is available 48-96 hours after online publication and is updated daily on week days.
Initial download of the metrics may take a while.