Fig. 12
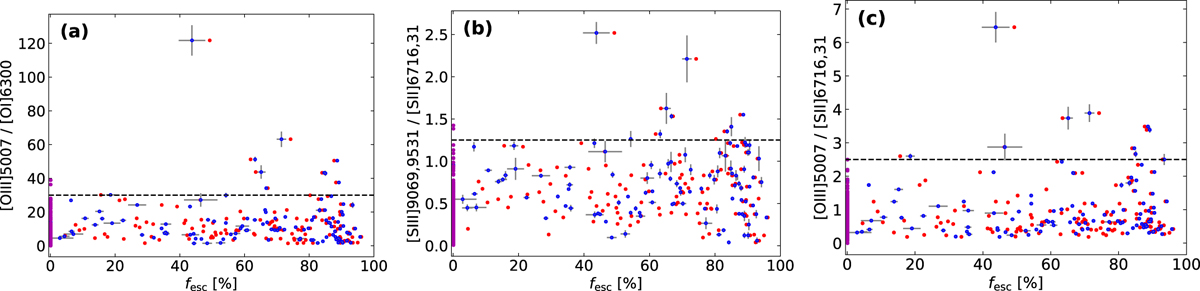
Ionization-parameter-sensitive line ratios against Lyman-continuum escape fraction (fesc) for our sample of HII regions. Panel a: line ratio [O iii]5007/[O I]6300; panel b: [S iii]9068.9531/[S II]6716.31, and panel c: [O iii]5007//[S II]6716.31. In all plots, the blue points are the results using the GALEV model while the red points shows the escape fraction computed using SB99. 1σ ranges of the statistical error of both axes are plotted as gray lines for the GALEV results. Violet points at the left border are those regions which were found to be optically thick. Horizontal dashed lines denote lower limits of the line ratios with high escape fraction, as discussed in the text.
Current usage metrics show cumulative count of Article Views (full-text article views including HTML views, PDF and ePub downloads, according to the available data) and Abstracts Views on Vision4Press platform.
Data correspond to usage on the plateform after 2015. The current usage metrics is available 48-96 hours after online publication and is updated daily on week days.
Initial download of the metrics may take a while.