Fig. 11
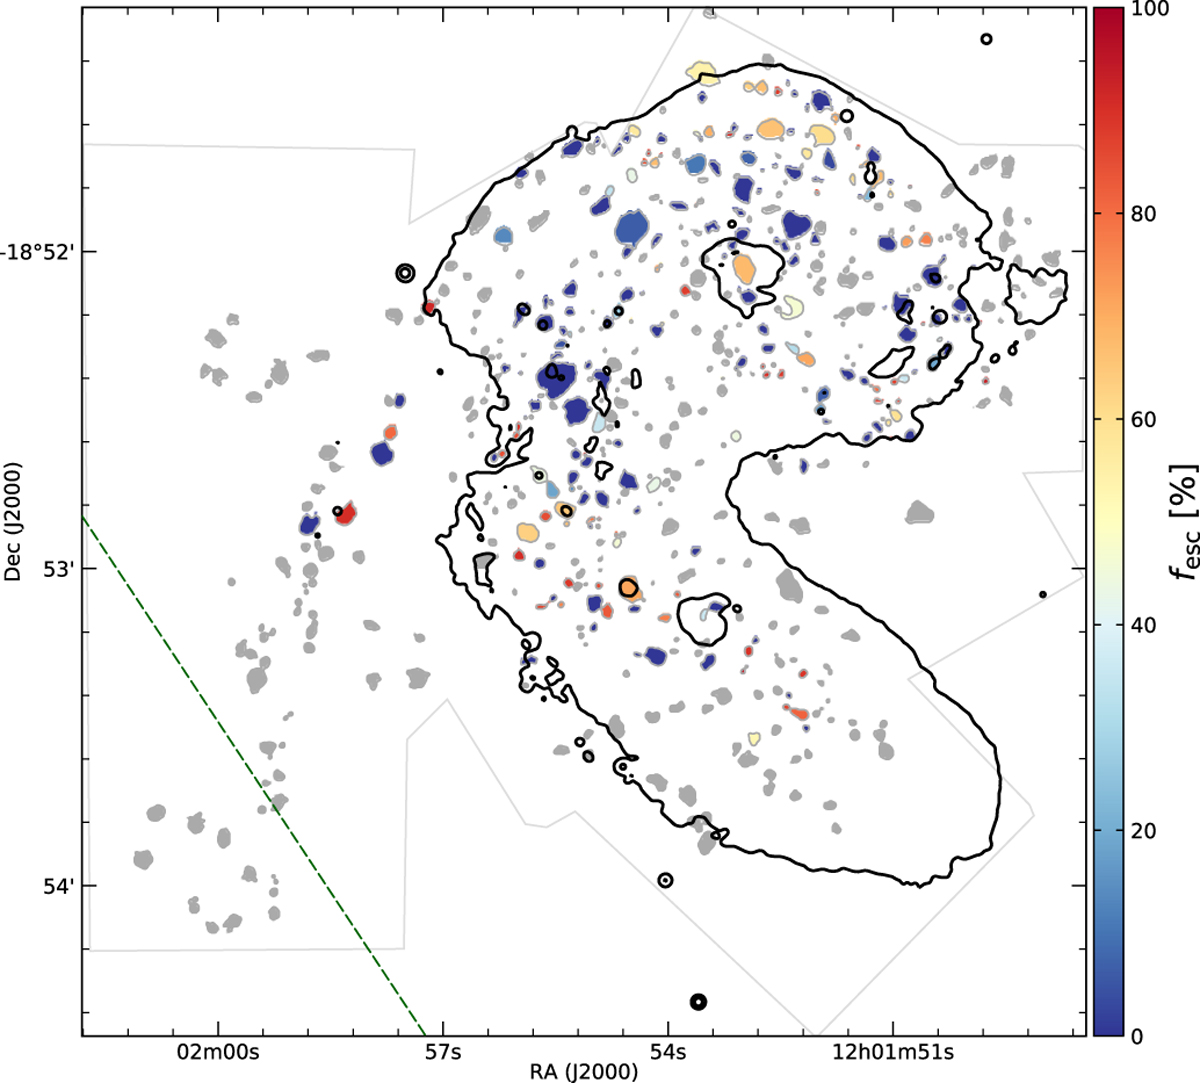
H II regions detected in the central Antennae. Here, the color indicates the Lyman-continuum escape fraction fesc, estimated bycomparing Hα luminosity and illuminating young star cluster(s). All colored regions have a positive escape fraction, other regions are filled light gray. The contours are the same broad-band levels as in Fig. 1, and the dashed dark-green line shows the approximate limit of the HST imaging.
Current usage metrics show cumulative count of Article Views (full-text article views including HTML views, PDF and ePub downloads, according to the available data) and Abstracts Views on Vision4Press platform.
Data correspond to usage on the plateform after 2015. The current usage metrics is available 48-96 hours after online publication and is updated daily on week days.
Initial download of the metrics may take a while.