Fig. 1
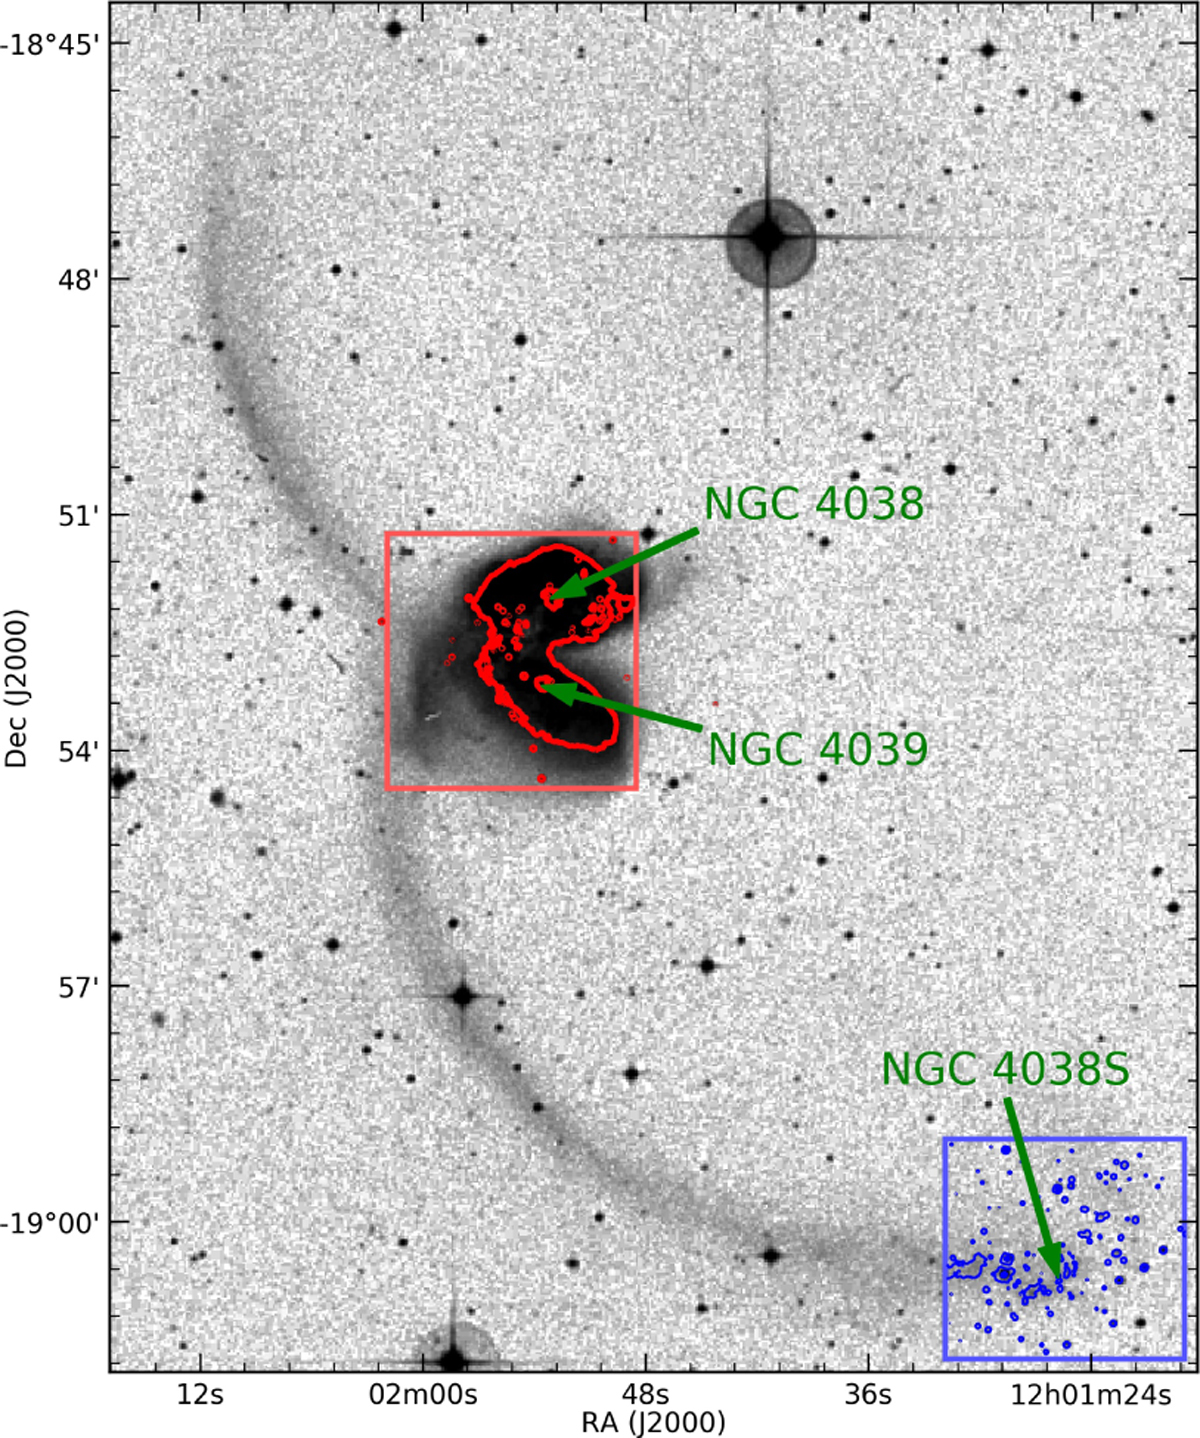
Antennae as seen on the blue Digital Sky Survey, version 2. The light red and light blue boxes show the outer edges of the MUSE coverage as used in all further plots. The red contours mark arbitrary continuum levels derived from a smoothed HST ACS image in the F814W filter in the central interacting galaxy. The two galaxy nuclei can be used to relate their location in other figures in this paper. The blue contours are similarly derived from HST data in the region near the tip of the southern tidal tail, they mark mostly foreground stars and background objects. The two bright stars in this region can be used to relate the location of this field to the other figures in this paper. This region is sometimes called NGC 4038 S in the literature; here, we use the term south or southern to describe it.
Current usage metrics show cumulative count of Article Views (full-text article views including HTML views, PDF and ePub downloads, according to the available data) and Abstracts Views on Vision4Press platform.
Data correspond to usage on the plateform after 2015. The current usage metrics is available 48-96 hours after online publication and is updated daily on week days.
Initial download of the metrics may take a while.