Fig. 1
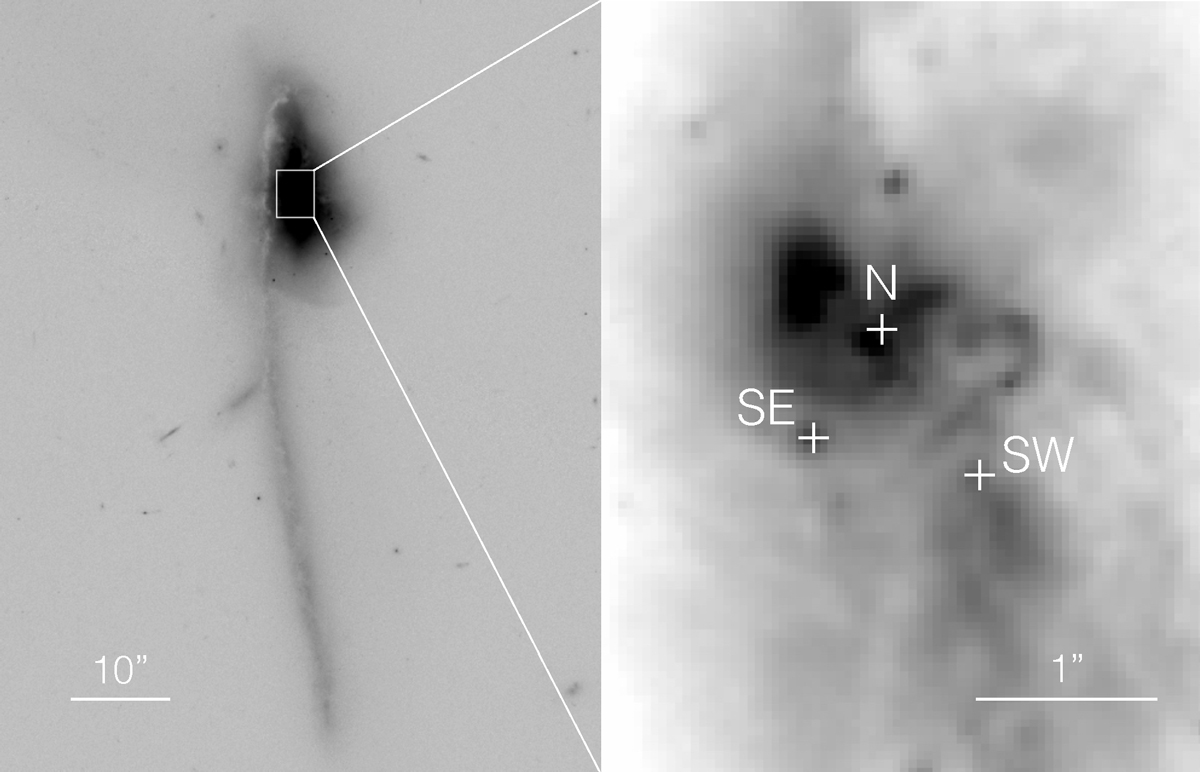
Left: HST/ACS I (F814W) band image of Mrk 273. The image orientation is north up, east to the left. The box indicates the zoomed region in the right panel. Right: the nuclear region of Mrk 273 is shown. Positions of the three radio components, N, SW, and SE (Condon et al. 1991) are denoted by plus symbols. Much of the far-infrared emission arises from the N nucleus while Chandra imaging found the SW nucleus to be a primary hard X-ray source (see Iwasawa et al. 2011 for X-ray source identification).
Current usage metrics show cumulative count of Article Views (full-text article views including HTML views, PDF and ePub downloads, according to the available data) and Abstracts Views on Vision4Press platform.
Data correspond to usage on the plateform after 2015. The current usage metrics is available 48-96 hours after online publication and is updated daily on week days.
Initial download of the metrics may take a while.